

For two years, high-density multifamily was the default answer to almost every residential site. That changed this quarter.
In the Q3 2026 edition of The Deals Developers Are Analyzing Today, our friends at Thesis Driven analyzed more than 100,000 site analyses run on TestFit last quarter. One finding stood out: higher-density multifamily now accounts for 45.2% of residential feasibility runs. Two years ago it was 61.6%. This is the first time it has dropped below half since tracking began.
This is a leading indicator, not a count of construction starts. Feasibility runs show what developers are seriously considering before they buy land. When that activity moves, the pipeline follows months later.
That makes this quarter worth a close look. The shift tells you where land bids, design budgets, and capital conversations are heading next year. Developers who read it early can position their pipeline before the rest of the market catches up.
The numbers behind the shift
The decline is not a slow drift. It accelerated in Q3.
- Share of residential runs: 61.6% in Q3 2024, 45.2% in Q3 2026
- Raw volume: down 39% in six months, from a peak of 25,022 runs in Q1 2026 to 15,195 in Q3
- The densest projects: sites tested at 120+ dwelling units per acre fell from 19.8% to 11.0% of residential activity, a 44% drop
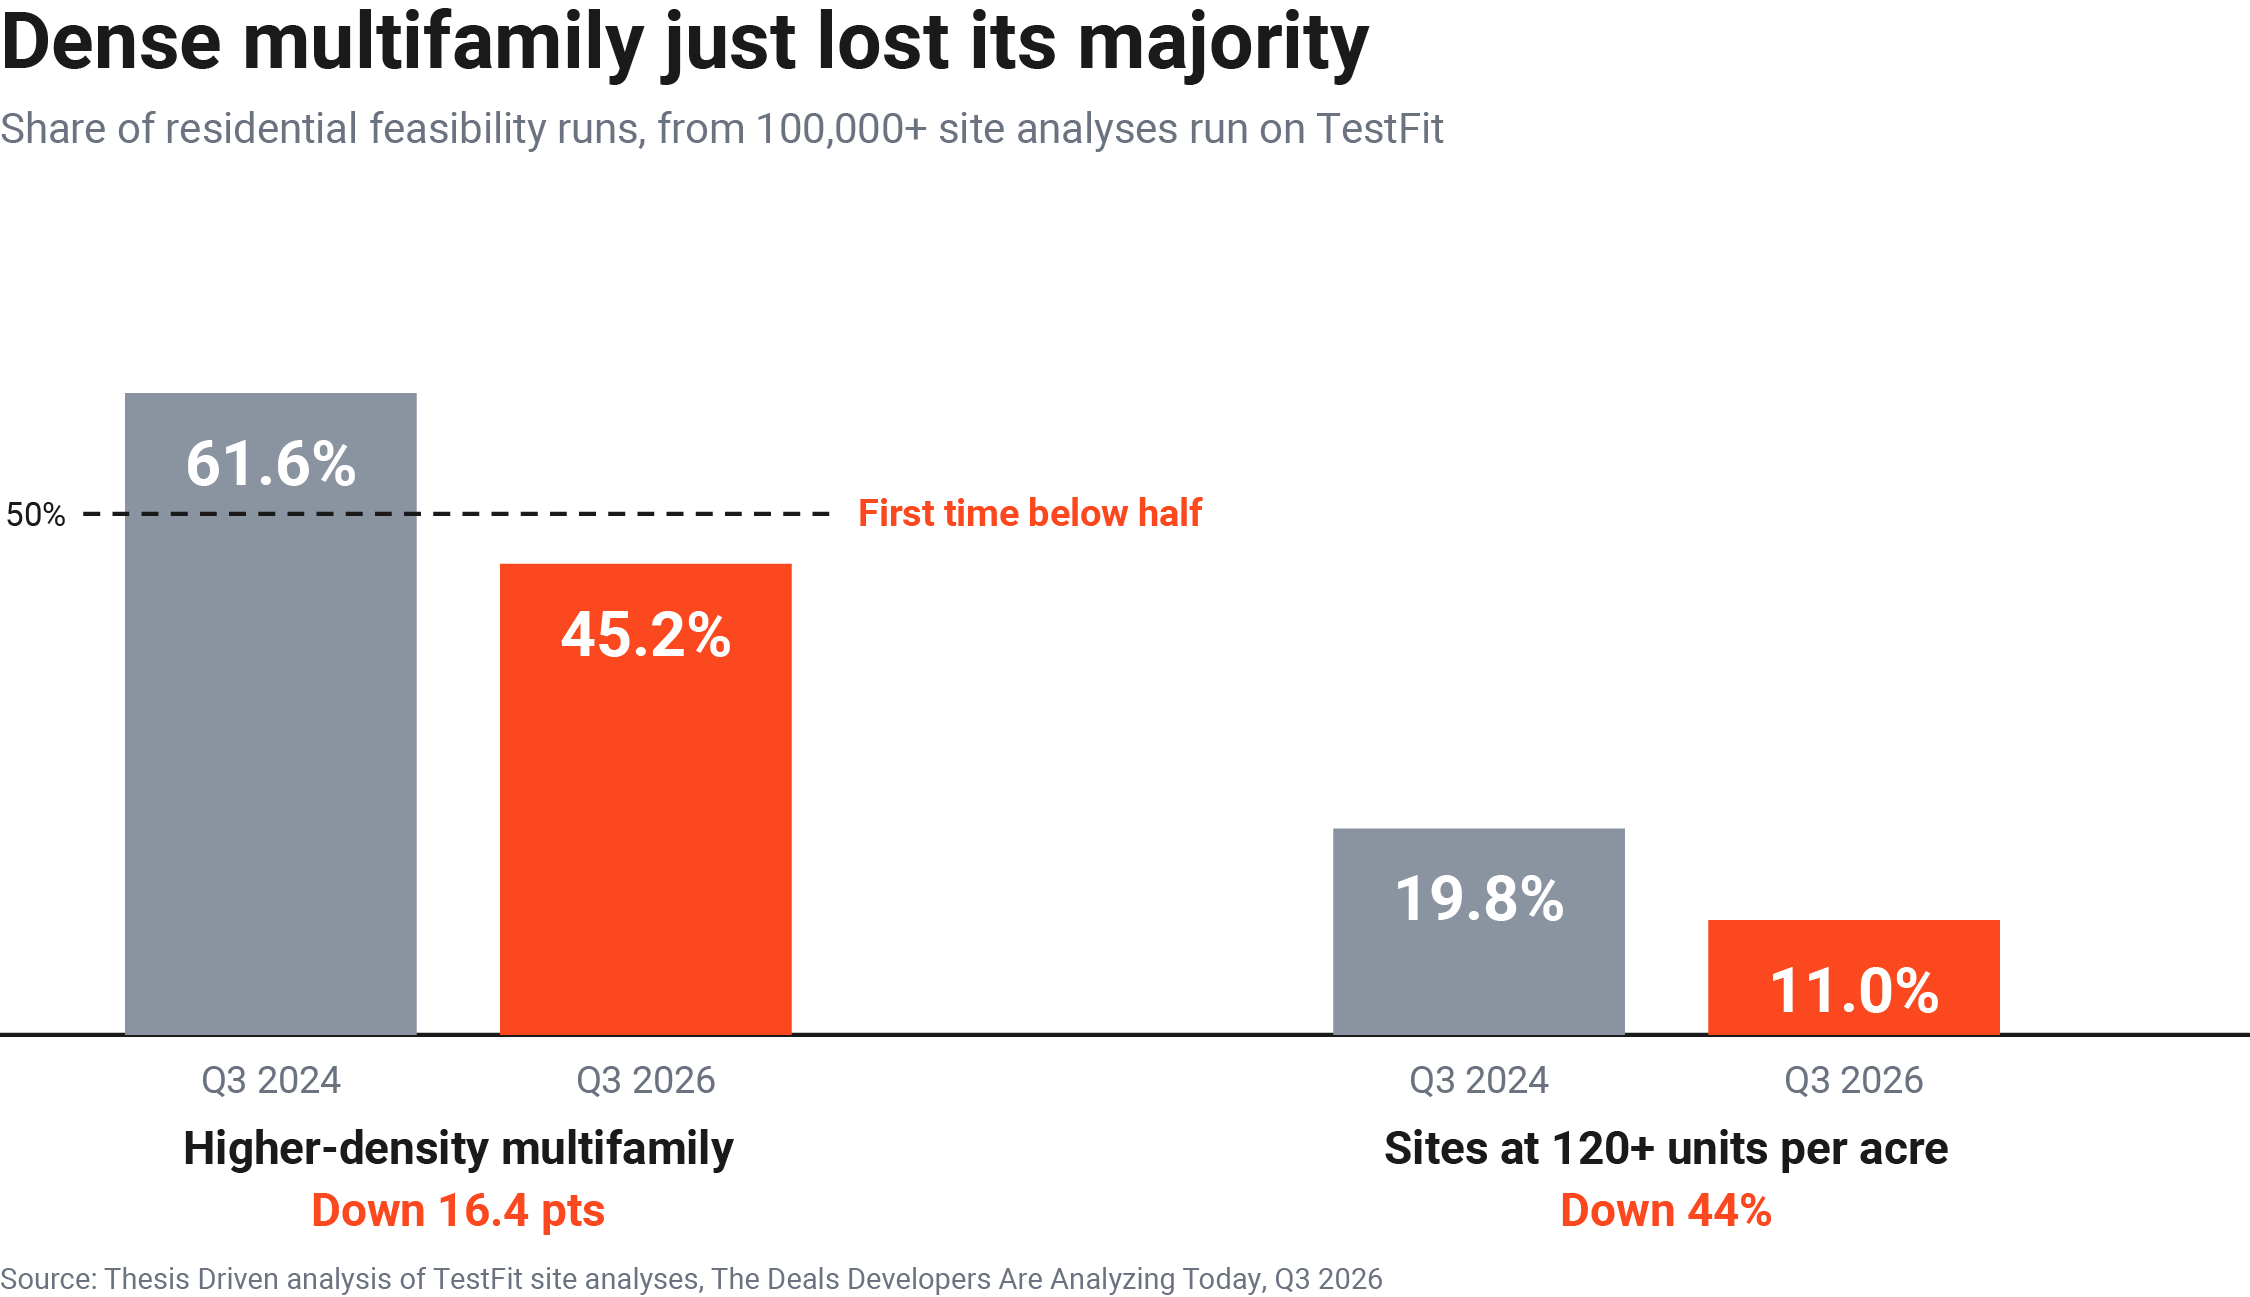
The steepest losses are at the top of the density curve. Concrete podium and high-rise projects, the ones with the highest cost per unit, are the ones developers are testing least.
Not all of that is lost density. Over the same two years, Thesis Driven found garden product rising from 6.9% to 10.3% of residential runs, a dataset high. Mid-density urban product, which the report calls "gurban," climbed from 13.0% to 19.0%.
Floor area ratio tells the same story. Sites tested under 0.5 FAR grew from 35.1% to 46.4% of runs. The 2.5 to 5.0 FAR band fell from 17.7% to 9.3%.
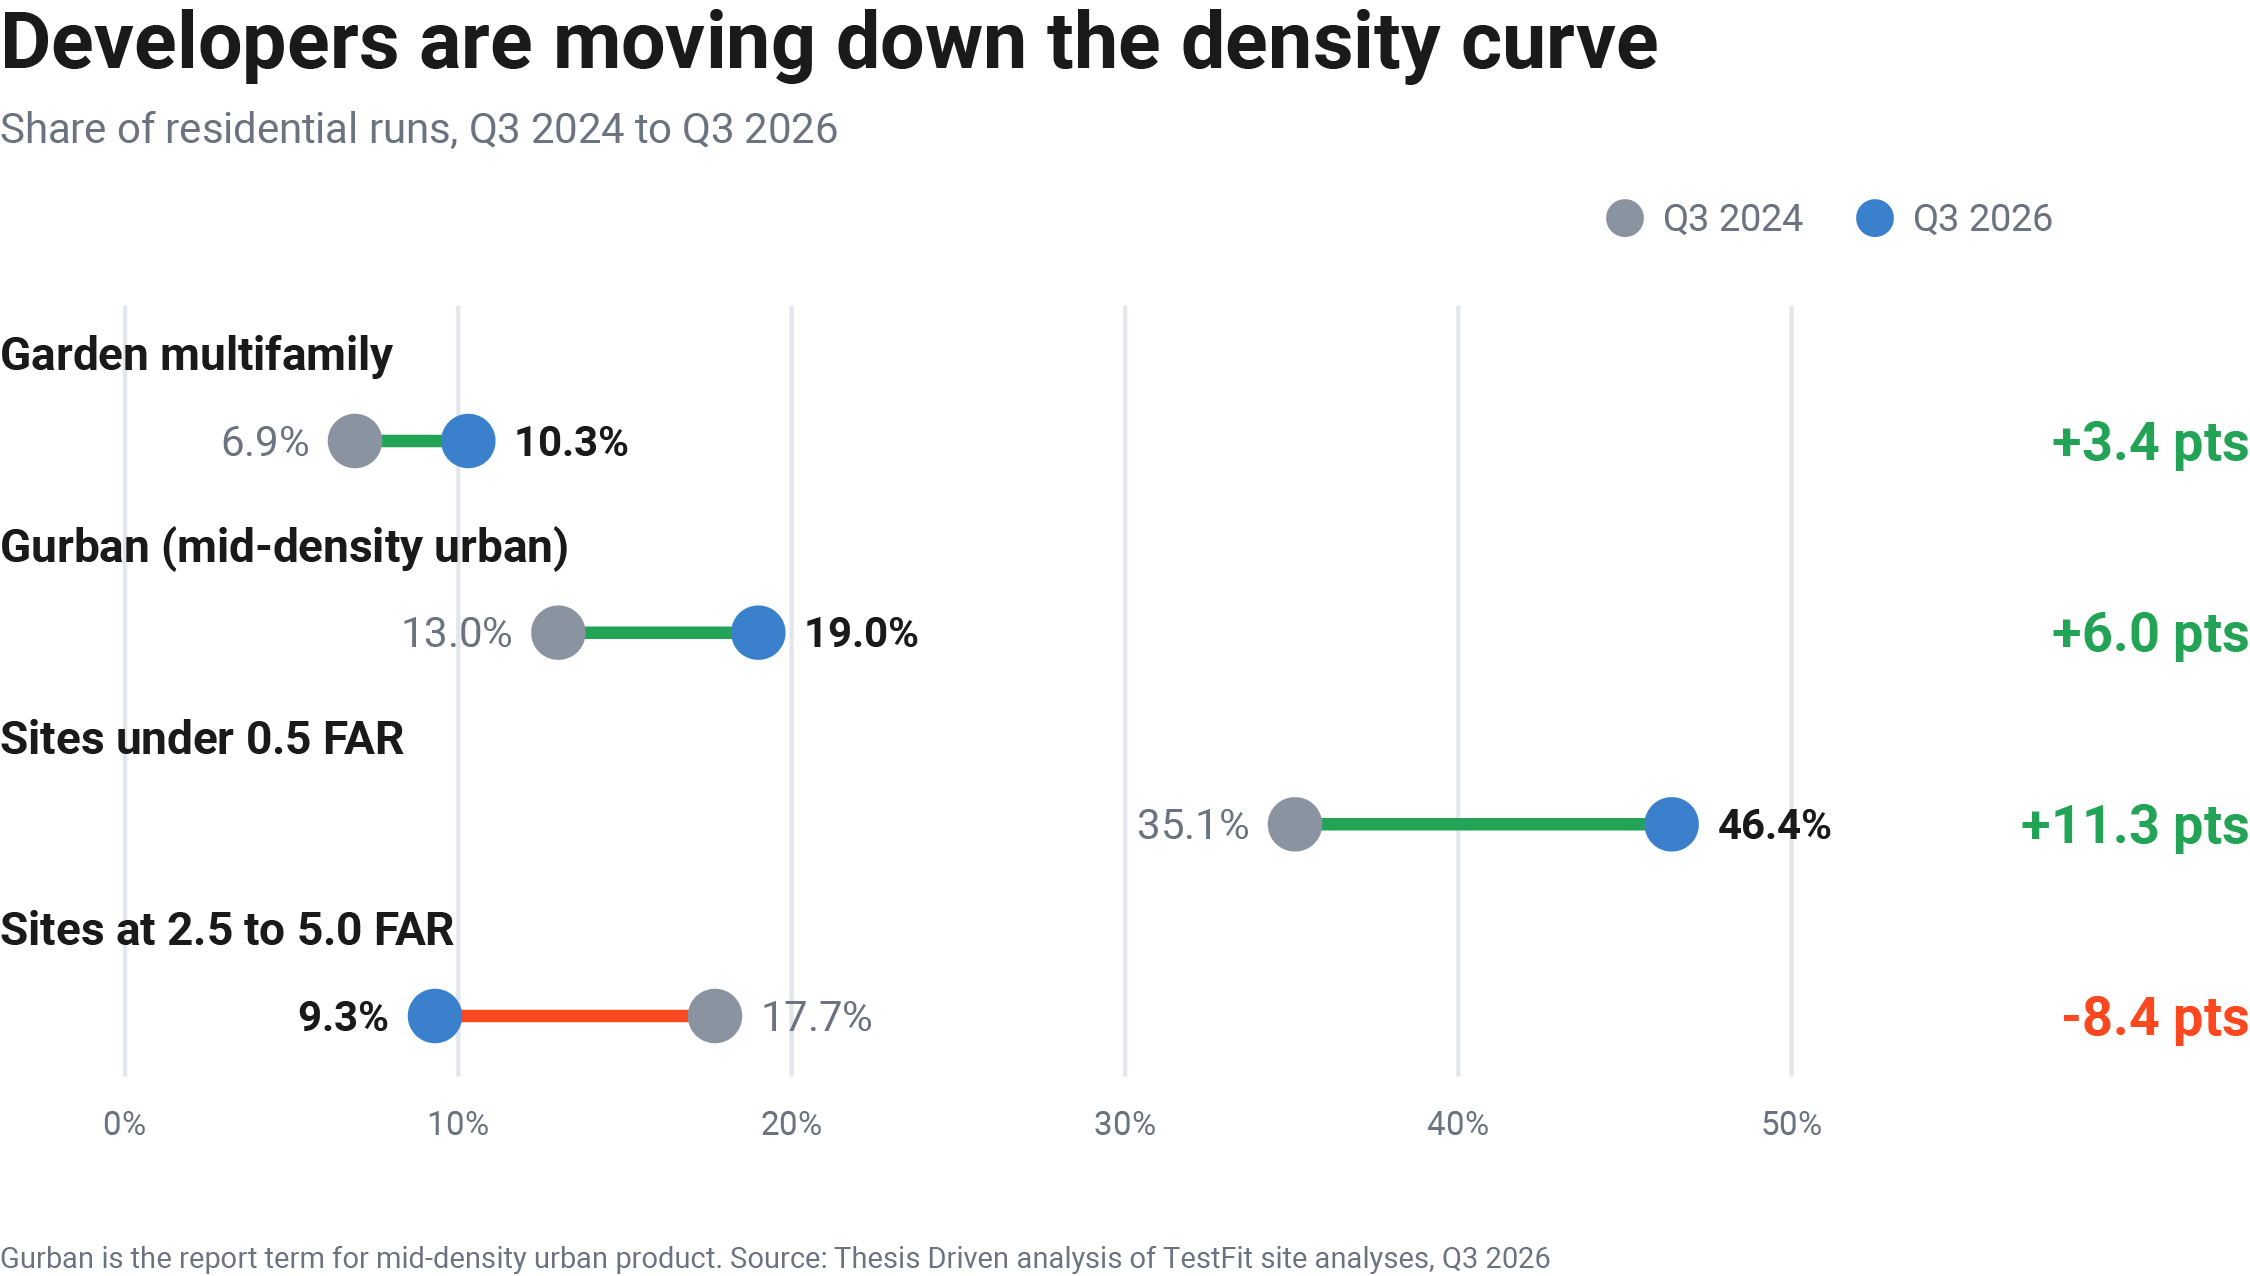
Developers are not leaving residential. They are moving down the density curve, toward product that is cheaper per unit and quicker to deliver.
Three forces pulling developers away from density
1. Build-to-rent and horizontal formats are absorbing attention
Build-to-rent communities, townhomes, and garden product offer faster delivery, simpler construction, and lower capital per unit. Developers who once ran a podium scheme first are now starting with horizontal options and asking whether density adds enough value to justify the extra cost.
On a real deal, this shows up at the land stage. A seller prices a parcel on its maximum zoned density. The buyer tests a podium, sees the cost per unit, and then asks what a horizontal product would pay for the same dirt. That second answer often sets the bid.
Horizontal formats also phase well. A developer can deliver the first buildings, start leasing, and fund later phases from early results. A podium has to be finished before it earns anything.
2. Sun Belt rents are still digesting the supply wave
Much of the 2022 to 2024 construction boom landed in Sun Belt metros. That supply is still being absorbed, and rent growth in many of those markets remains soft. Projections that leaned on aggressive rent bumps no longer hold, so dense projects that needed those bumps are getting shelved earlier.
Soft rent growth hits dense projects hardest because they carry the most cost per unit. A small miss on rent becomes a large miss on return when the denominator is a concrete podium. Lower-cost formats leave more room for error, which is exactly what lenders and capital partners want to see right now.
3. Construction costs did not follow rates down
The effective federal funds rate has fallen from 5.33% in July 2024 to 3.63% today. Many expected that drop to bring shelved deals back. It has not. Hard costs for concrete, steel, and skilled labor remain high, and a lower rate on a project that still costs too much to build does not fix the math.
Rates help the financing side of the pro forma. They do nothing for the cost side. For a dense project, structure, vertical transportation, and structured parking can outweigh any savings on interest.
Parking adds pressure too. The median parking ratio on higher-density runs rose from 1.08 stalls per unit in Q1 2026 to 1.22 in Q3. More stalls per unit means more structured parking in dense schemes, and structured stalls are expensive.
What this means for developers and their design teams
The opportunity is not in abandoning density. It is in testing it honestly against the alternatives on every site.
The developers who win this cycle will not be the ones who guess the right typology. They will be the ones who test enough options to know which one works on each specific parcel.
- Run more than one typology per site. The site that failed as a podium may work as a garden community, a townhome product, or a mid-density wrap. Testing three typologies takes the same afternoon as testing one when the tool keeps up.
- Revisit shelved sites with current assumptions. A site you passed on in 2024 under different rents, costs, and parking expectations deserves a fresh run.
- Find the density that pencils, not the maximum density. The highest unit count is rarely the best return when every added floor adds structure, parking, and time.
- Give architects better starting points. When a developer brings a tested scheme to the first design meeting, the design team spends its time on design, not on proving whether the site works.
A worked example: one site, three answers
The numbers below are illustrative. They use a hypothetical site and simple stated assumptions, not data from the report.
Take a hypothetical 4-acre infill site zoned for high density. The developer tests three schemes. Parking uses the report's 1.22 stalls per unit median for the denser schemes and roughly 1.5 for garden. Hard cost per unit is an assumption for comparison only.
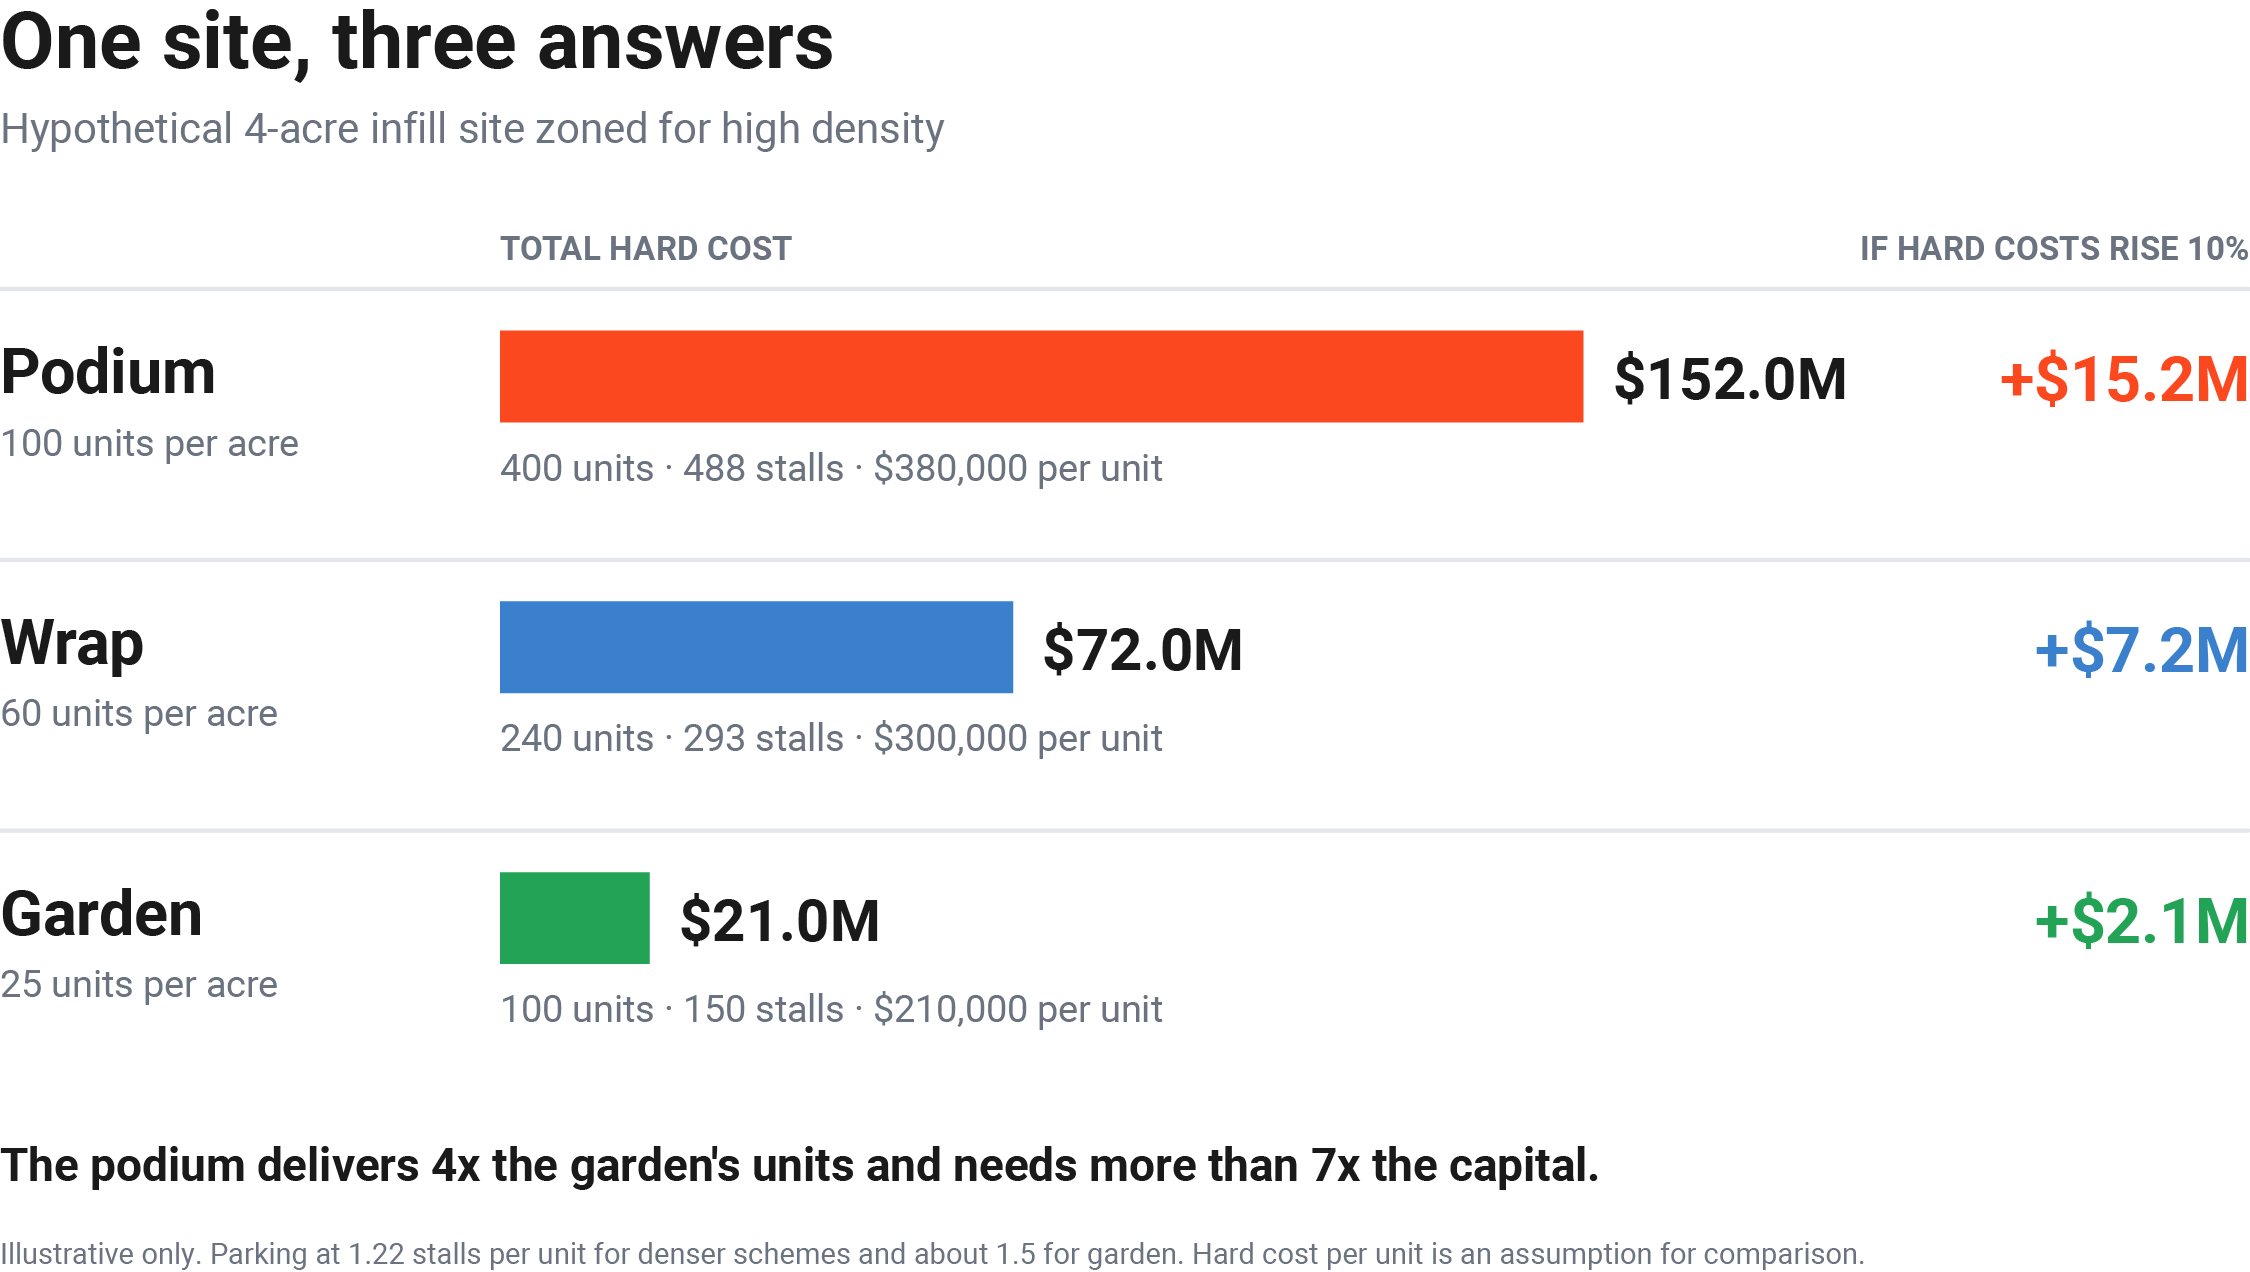
The podium delivers four times the garden's units. It also needs more than seven times the capital. A 10% rise in hard costs adds $15.2 million to the podium and $2.1 million to the garden.
None of this says the podium is wrong. On a site with strong rents and patient capital, it may still be the best answer. The point is that the developer only knows which scheme wins after testing all three against the same assumptions.
That comparison also changes the land conversation. If the garden or wrap scheme pencils and the podium does not, the land seller's price needs to reflect what the site can actually support today.
Frequently asked questions
Is high-density multifamily development declining in 2026?
Its share of feasibility activity is. Thesis Driven's analysis of TestFit data shows higher-density multifamily fell from 61.6% of residential runs in Q3 2024 to 45.2% in Q3 2026. Feasibility runs lead construction starts, so this signals a shift in future pipelines.
What are developers testing instead of dense multifamily?
Lower-density product is gaining share. Garden multifamily rose from 6.9% to 10.3% of residential runs, and gurban rose from 13.0% to 19.0%. Build-to-rent and horizontal formats are also absorbing more attention.
Why didn't lower interest rates revive dense projects?
Rates fell from 5.33% in July 2024 to 3.63%, but construction costs did not follow. A cheaper loan on a project that still costs too much to build does not fix the return.
Should developers stop pursuing high-density sites?
No. The better move is to test density against alternatives on each site and pick the scheme that pencils. Some sites will still favor a podium or high-rise.
Why this data comes from TestFit
The trend above is not a survey or a sentiment index. It comes from what developers actually did inside TestFit: more than 100,000 site analyses in a single quarter, tracked with Thesis Driven for nine consecutive quarters.
That volume exists because TestFit has been the feasibility platform developers trust for more than a decade. When a developer wants to know what a site can hold, they open TestFit, define the site, set the constraints, and get real unit counts, parking, and yield in minutes. TestFit calculates, it does not guess.
That scale gives the trend weight. A single brokerage report or survey reflects a handful of opinions. More than 100,000 site analyses per quarter reflect what developers are actually underwriting, before they commit capital.
Customers see the speed difference in their own work. In TestFit's 2026 ROI report, survey respondents cut feasibility time by 80%, from 11 to 25 hours per study down to 0 to 5. Developers save 18 hours per feasibility study and create 5x more design iterations per site. Respondents also make go/no-go decisions 1.5x faster.
Individual teams tell the same story. Trinity Commercial Group cut site planning from 30 days to a week. Prince Property Group can create 12 schemes in one sitting and sizes up a site in 10 minutes. Sami Khoury, a principal at AC Martin, averages at least one feasibility study a day for clients.
That is also why TestFit is the right place to act on this shift:
- Every typology on one site. Garden, townhome, wrap, podium, and high-rise schemes can be generated and compared on the same parcel, side by side.
- Generative design that explores the options for you. Instead of drawing one scheme, explore many configurations and rank them by the metrics that matter to your deal.
- Live tabulations and pro forma. Unit mix, parking, and financial results update as the design changes, so you see what density is worth before anyone draws it.
- Site intelligence built in. Parcels, flood zones, wetlands, and utilities sit alongside the design, so the first scheme already reflects the real site.
- Responsive parking. Surface, structured, or tuck-under parking is laid out as real stalls and drive aisles, and it updates as the massing changes.
- Shareable deals with unlimited users. Developers, architects, and capital partners can review the same scheme without passing files back and forth.
When the market moves this fast, the developers who win are the ones who can test the next idea before the competition finishes testing the last one.
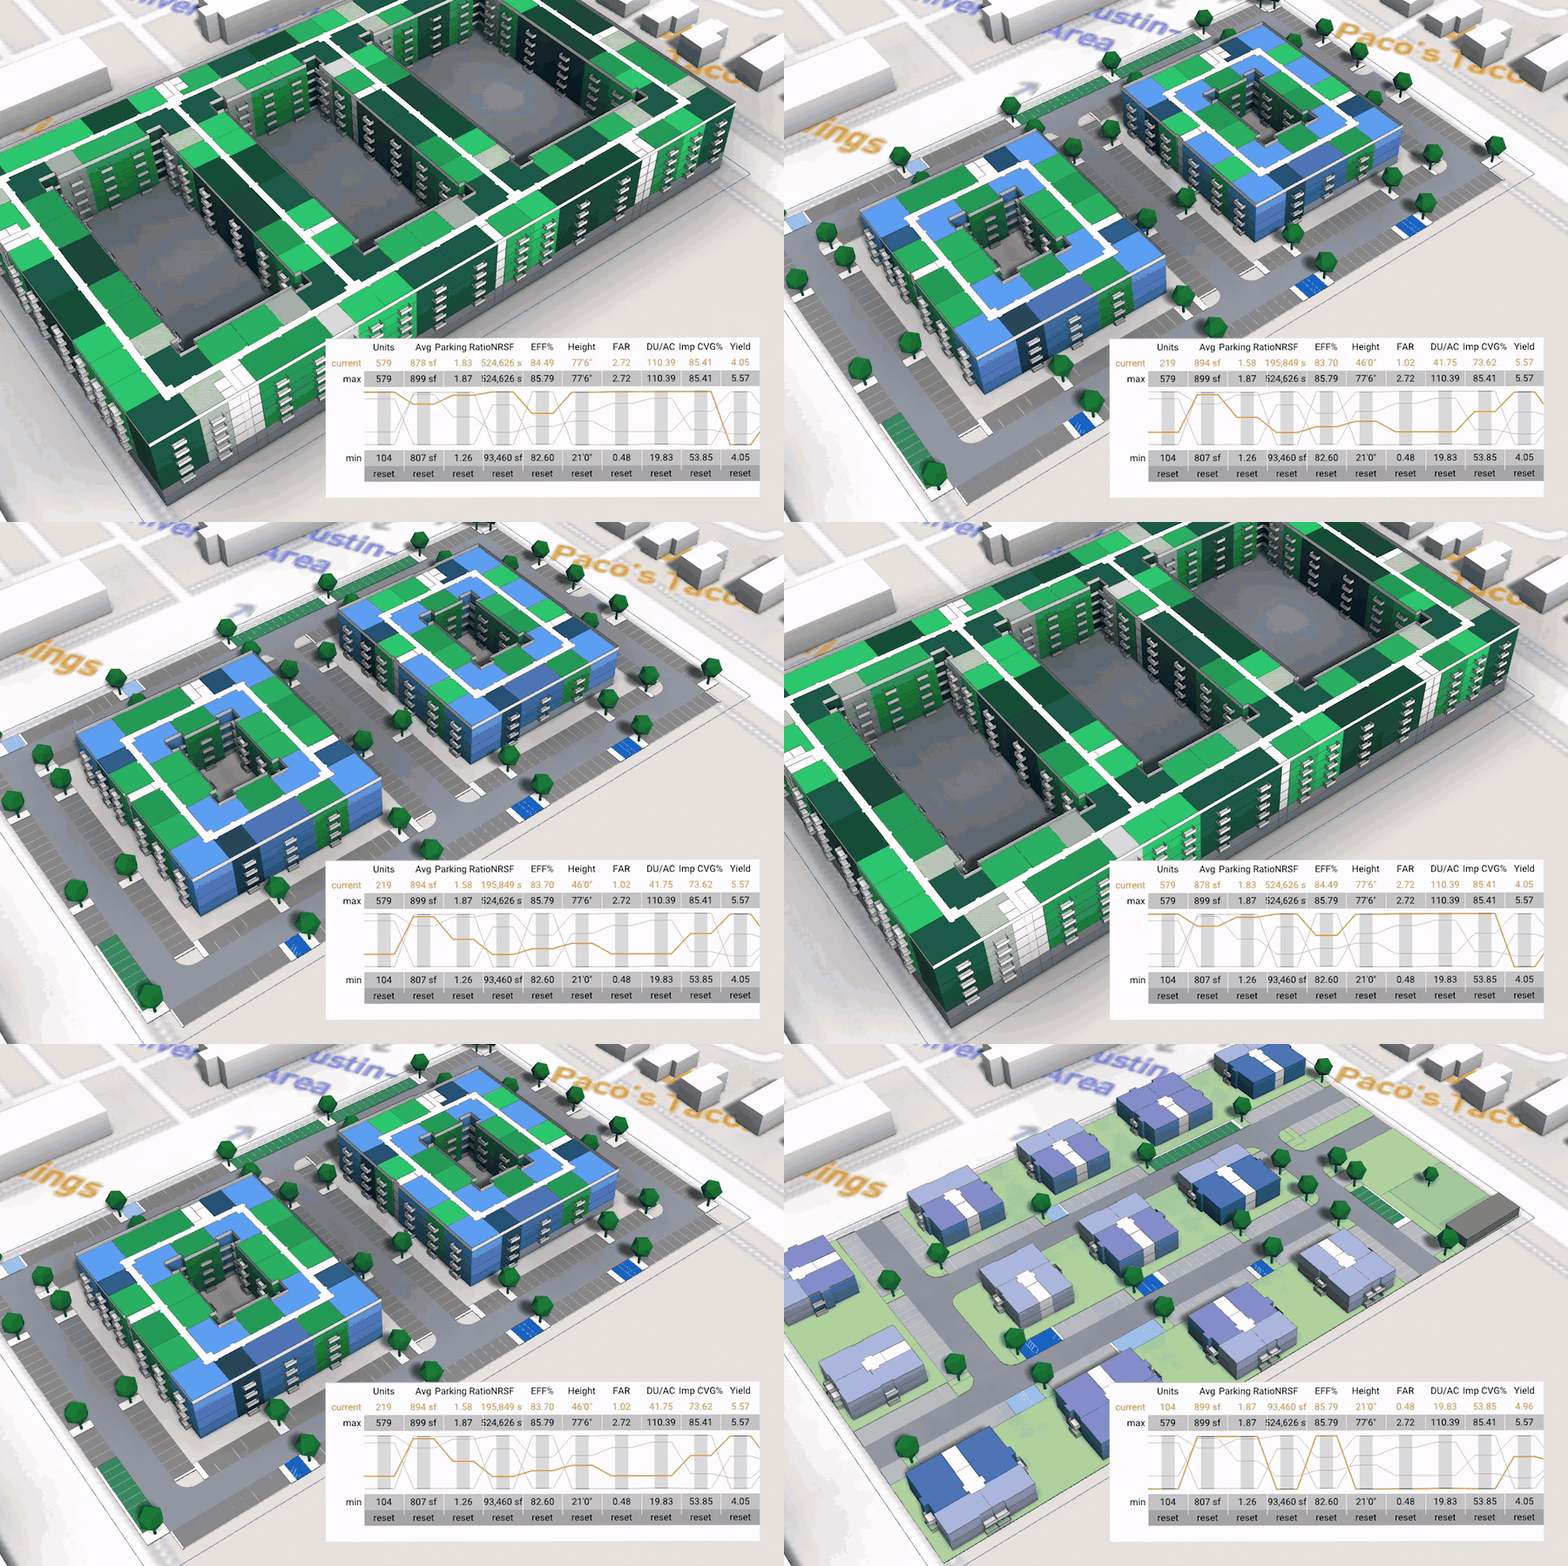
Ready to see what your shelved sites can do today? Book a quick demo and run your site with current assumptions.
Source: Thesis Driven, The Deals Developers Are Analyzing Today, Q3 2026 Edition, based on TestFit platform data.