For any land development, civil engineering, or construction project, cut-and-fill calculations are a crucial early step in site grading. Accurate earthwork estimation can significantly impact the project's cost, timeline, and environmental footprint.
In this comprehensive guide, you’ll learn what cut and fill means, how to read cut and fill maps, and how to calculate volumes using 3 main methods: cross-section, grid, and automated tools.
What Is Cut and Fill?
Cut and fill is the process of redistributing soil on a site to create a level or otherwise specified surface.
- Cut refers to excavating or removing earth from higher ground.
- Fill means adding earth to lower areas to raise the grade.

The primary objective of any cut-and-fill operation is to balance the two—meaning the amount of material removed is reused as fill elsewhere on site. When balanced, you reduce the need for importing or exporting material, which lowers costs and environmental impact.
Cut-and-fill operations are common in:
- Subdivision grading
- Road construction
- Infrastructure and utility trenching
- Parking lots and large flatwork areas
- Industrial and commercial site development
How Are Cut-and-Fill Maps Used?
Before you begin moving dirt, you’ll typically create or analyze a cut-and-fill map. These maps help visualize how the proposed design compares to the existing terrain. By overlaying design contours on topographic surveys, planners can identify zones where the earth needs to be cut or filled.

Cut-and-fill maps are often color-coded:
- Red or orange = cut areas
- Blue or green = fill areas
- Neutral areas = minimal change
Using tools like terrain modeling software (e.g., Civil 3D, TestFit, or Propeller), these maps are generated from topographic survey data, typically obtained via drone LiDAR, photogrammetry, or total station measurements.
Key Terrain Features in Cut and Fill Maps
Understanding how terrain features appear in your site data is key to accurate earthwork estimation. Important components include:
1 - Contours and Spot Elevations
Contours show lines of constant elevation. Closer contours indicate steeper slopes, while wider spacing suggests flatter ground.
Spot elevations offer precise elevation data at specific points like corners, centerlines, or control points.

2 - Slopes and Gradients
Most building codes and grading plans will specify allowable slopes. Understanding cut and fill slope calculations ensures safe and code-compliant transitions between grades.
For example:
- Typical slope for landscaping = 2%–5%
- Maximum parking lot grade = 5%
- Max cut/fill slope = 2:1 or 3:1 (depends on soil type and stability)
3 - Breaklines and Boundaries
Breaklines define sharp elevation changes (e.g., curbs or retaining walls), and site boundaries help define the limits of grading.
How to Calculate Cut and Fill
Let’s break down the most effective cut-and-fill calculation methods for different project types and sizes.
1 - Cross-Section Method
This technique works well for long, linear projects like roads, pipelines, or railways.
Steps:
- Divide the site into evenly spaced sections (e.g., every 20–50 feet).
- At each cross-section, plot both existing and proposed elevations.
- Calculate the area between the two lines (representing cut or fill).
- Multiply the area by the distance between sections to get volume.
Example:
If one section shows a fill area of 100 sq ft and the next one 120 sq ft, and they're spaced 50 feet apart:
Volume = [(100 + 120) / 2] × 50 = 5,500 cu ft (or ~204 cu yds)
2 - Grid Method
Also known as the grid volume method, this is commonly used on flat to moderately sloped building sites like subdivision sites or parking lots.
Steps:
- Overlay a uniform grid on the site (e.g., 10'x10' or 5m x 5m).
- Record both existing and proposed elevations at each grid intersection.
- Subtract proposed from existing to get cut (+) or fill (–).
- Average the four values at each grid square and multiply by area.
Formula:
Volume = [(Z1 + Z2 + Z3 + Z4) / 4] × Grid Area
Repeat for each cell and sum all volumes.
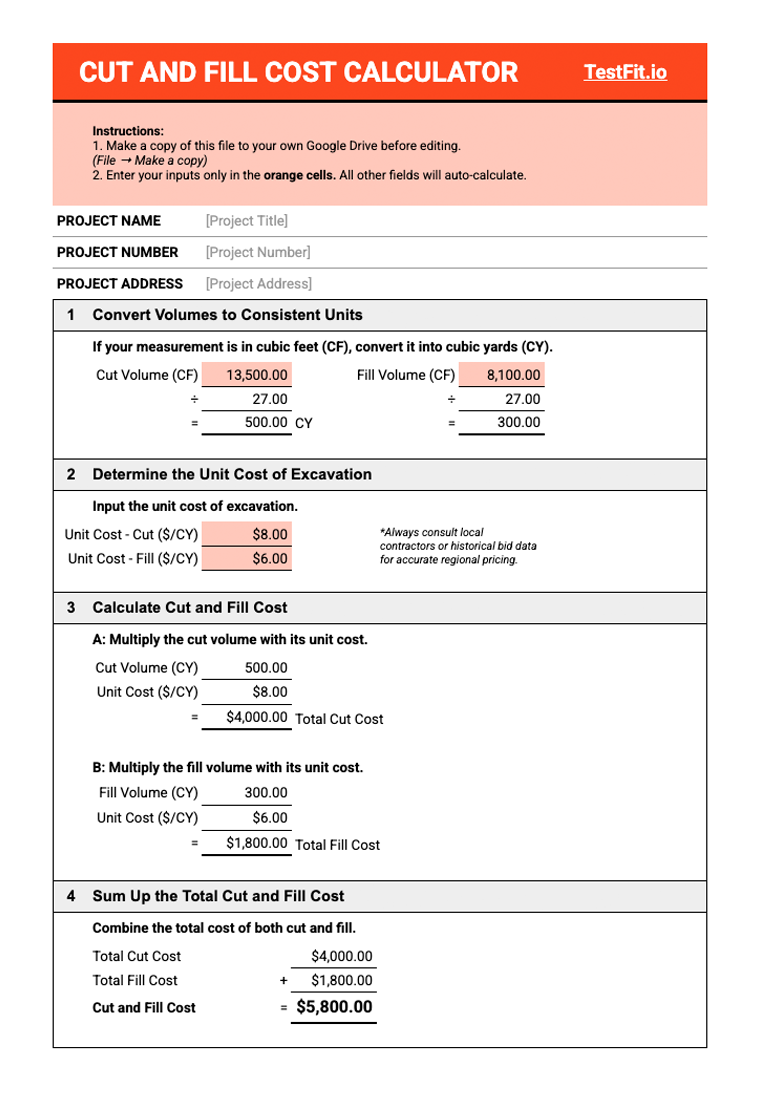
{{form}}
3 - Advanced Cut and Fill Software
Advanced tools can analyze digital terrain models (DTMs) to calculate earthwork volumes instantly, generate color-coded cut/fill maps, and visualize grading changes in real time. These tools are essential for speeding up workflows, improving accuracy, and reducing overall project costs.
Automate Cut and Fill Calculations
AI-powered platforms like TestFit not only perform automatic cut-and-fill calculations but also help development teams evaluate site feasibility, design efficiency, and grading optimization all in one place.
With TestFit, you can:
- Instantly calculate cut and fill volumes from site topography and building pads.
- Visually map out cut and fill zones over the base terrain model.
- Automatically balance volumes to reduce import/export of material.
- Receive immediate grading feedback as you adjust the building footprint, parking layout, or pad elevation.
- Filter multiple design options by cut and fill volume with generative design.
- Generate conceptual cost estimates tied directly to your cut and fill volumes.
- Export grading insights and volumes to share with engineers or plug into more detailed design workflows.
This ensures accurate volume balancing, enabling developers, civil engineers, and contractors to make early decisions that reduce earthwork costs, shorten construction timelines, and improve ROI.