.svg)


Most real estate glossaries are written for someone buying a building that already exists. They walk through cap rate, net operating income, and cash flow, the vocabulary of an investor comparing two stabilized properties side by side. A developer standing on a raw parcel needs a different set of numbers, because there is no stabilized income yet to divide by anything. The math that decides whether a project moves forward or dies on a spreadsheet happens earlier, and it runs on terms that rarely show up in the beginner-level glossaries built for buy-and-hold investors.
These ten terms are the ones that carry a ground-up deal from first gut check to a lender's desk. Get comfortable with them and a pro forma stops being a black box someone else fills in. It becomes a set of levers you can read for yourself. For the broader framework these terms sit inside, alongside zoning and geometric feasibility, see our post on evaluating site feasibility software.
Total Development Cost
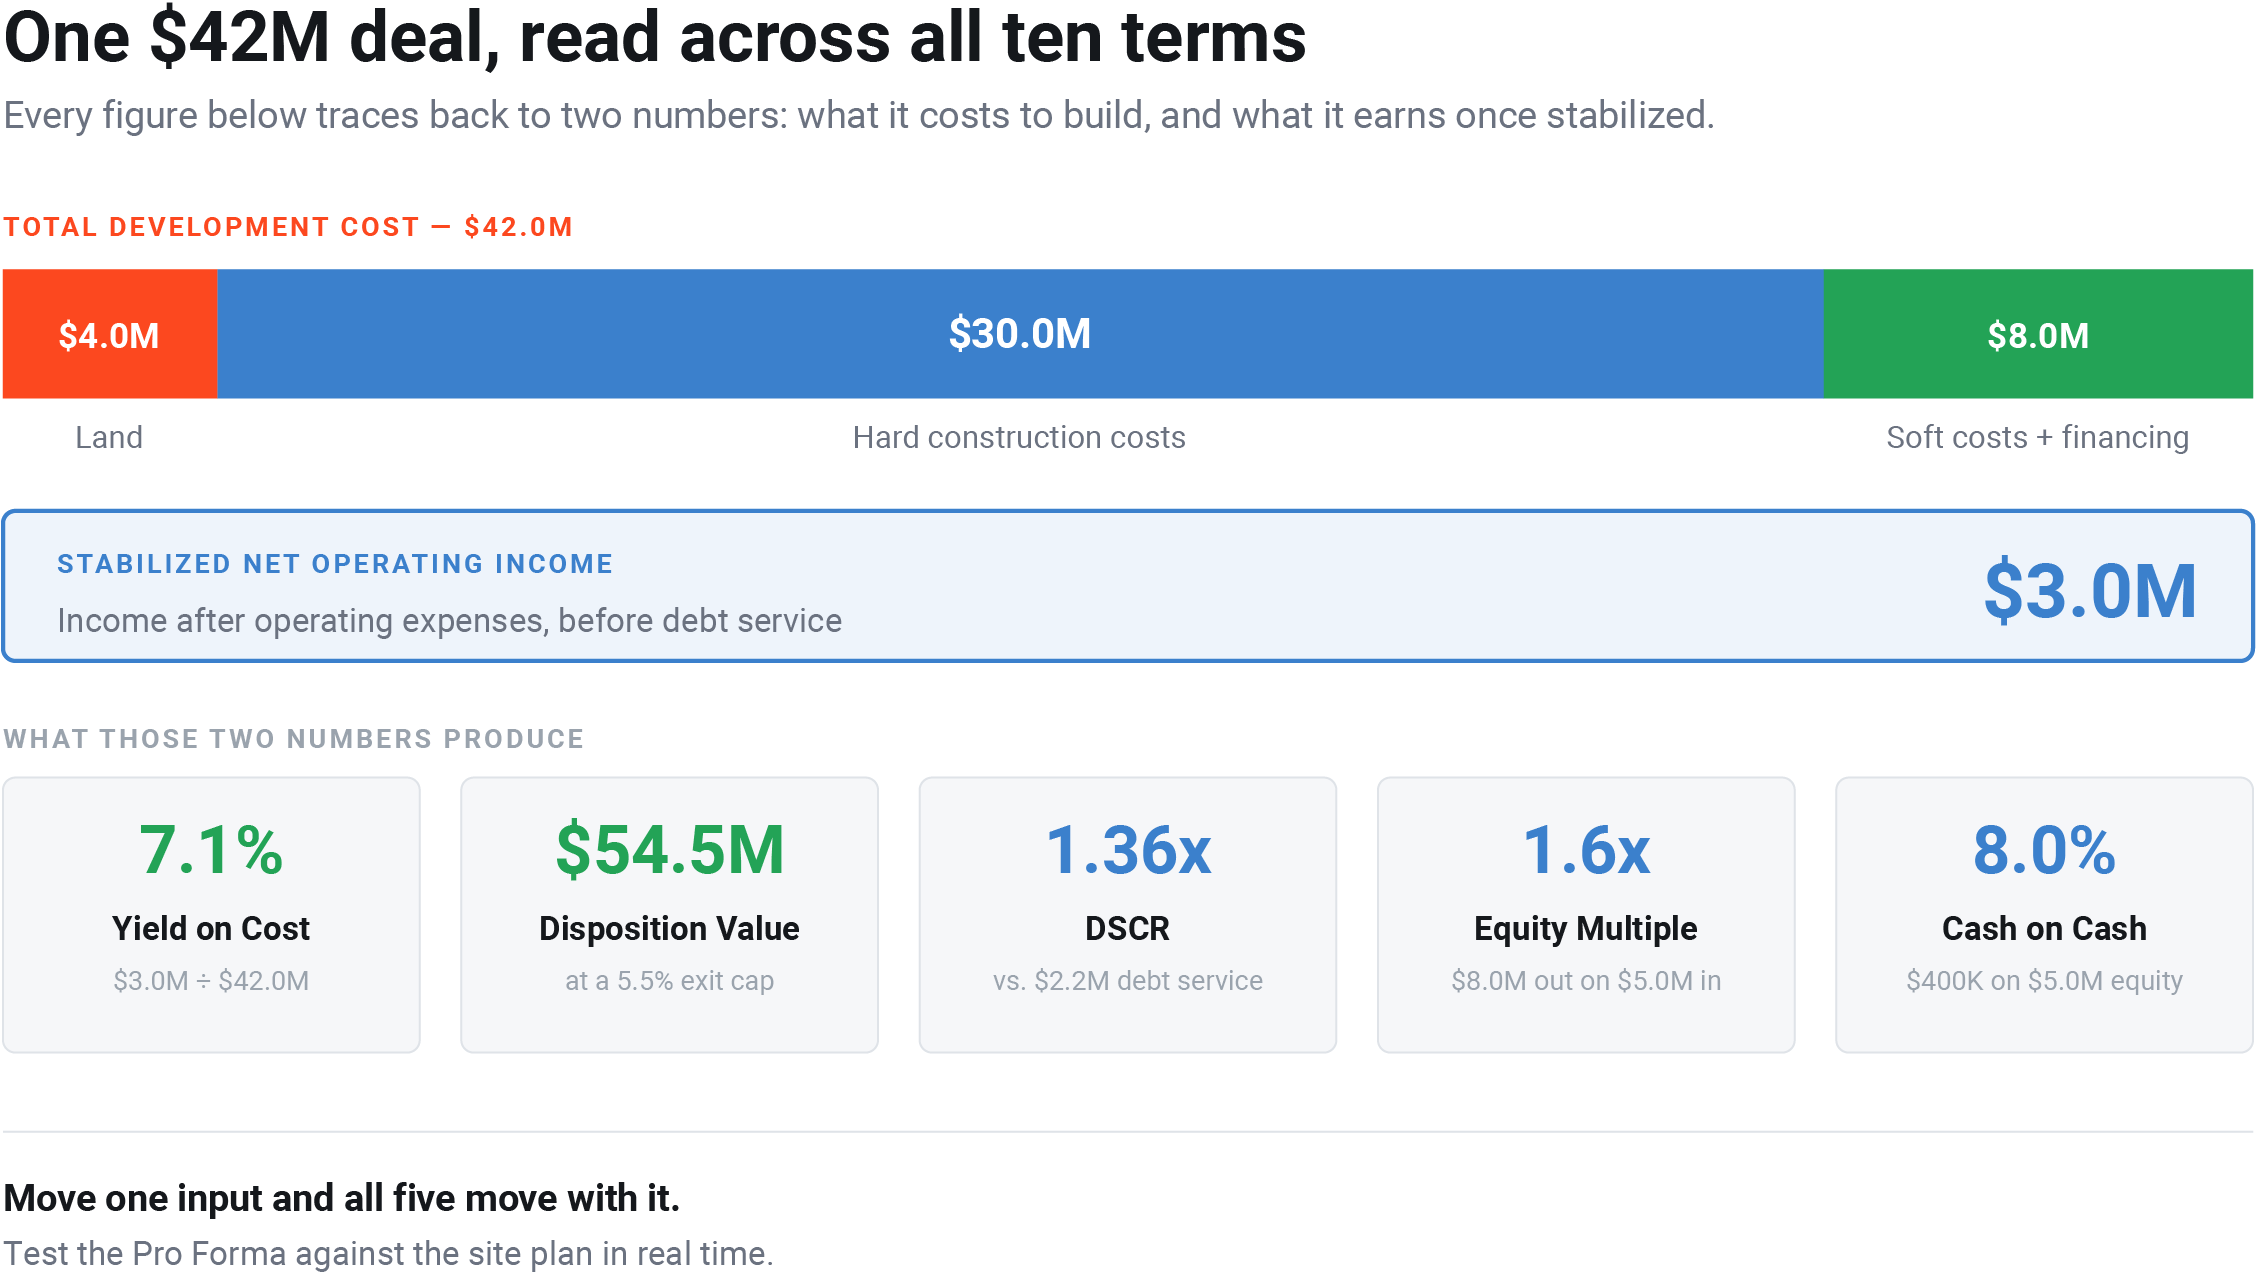
Total Development Cost, or TDC, is everything it takes to get a project from raw land to a certificate of occupancy: land acquisition, hard construction costs, soft costs like architecture and permitting, financing costs during construction, and a contingency reserve for the surprises every project has. TDC is the denominator underneath almost every other term on this list, so an error here compounds through the rest of the model. As an example, a project with a land cost of four million dollars, hard costs of thirty million, and soft costs and financing fees adding another eight million lands at a TDC of forty-two million dollars, and every return metric that follows gets measured against that number.
Net Operating Income
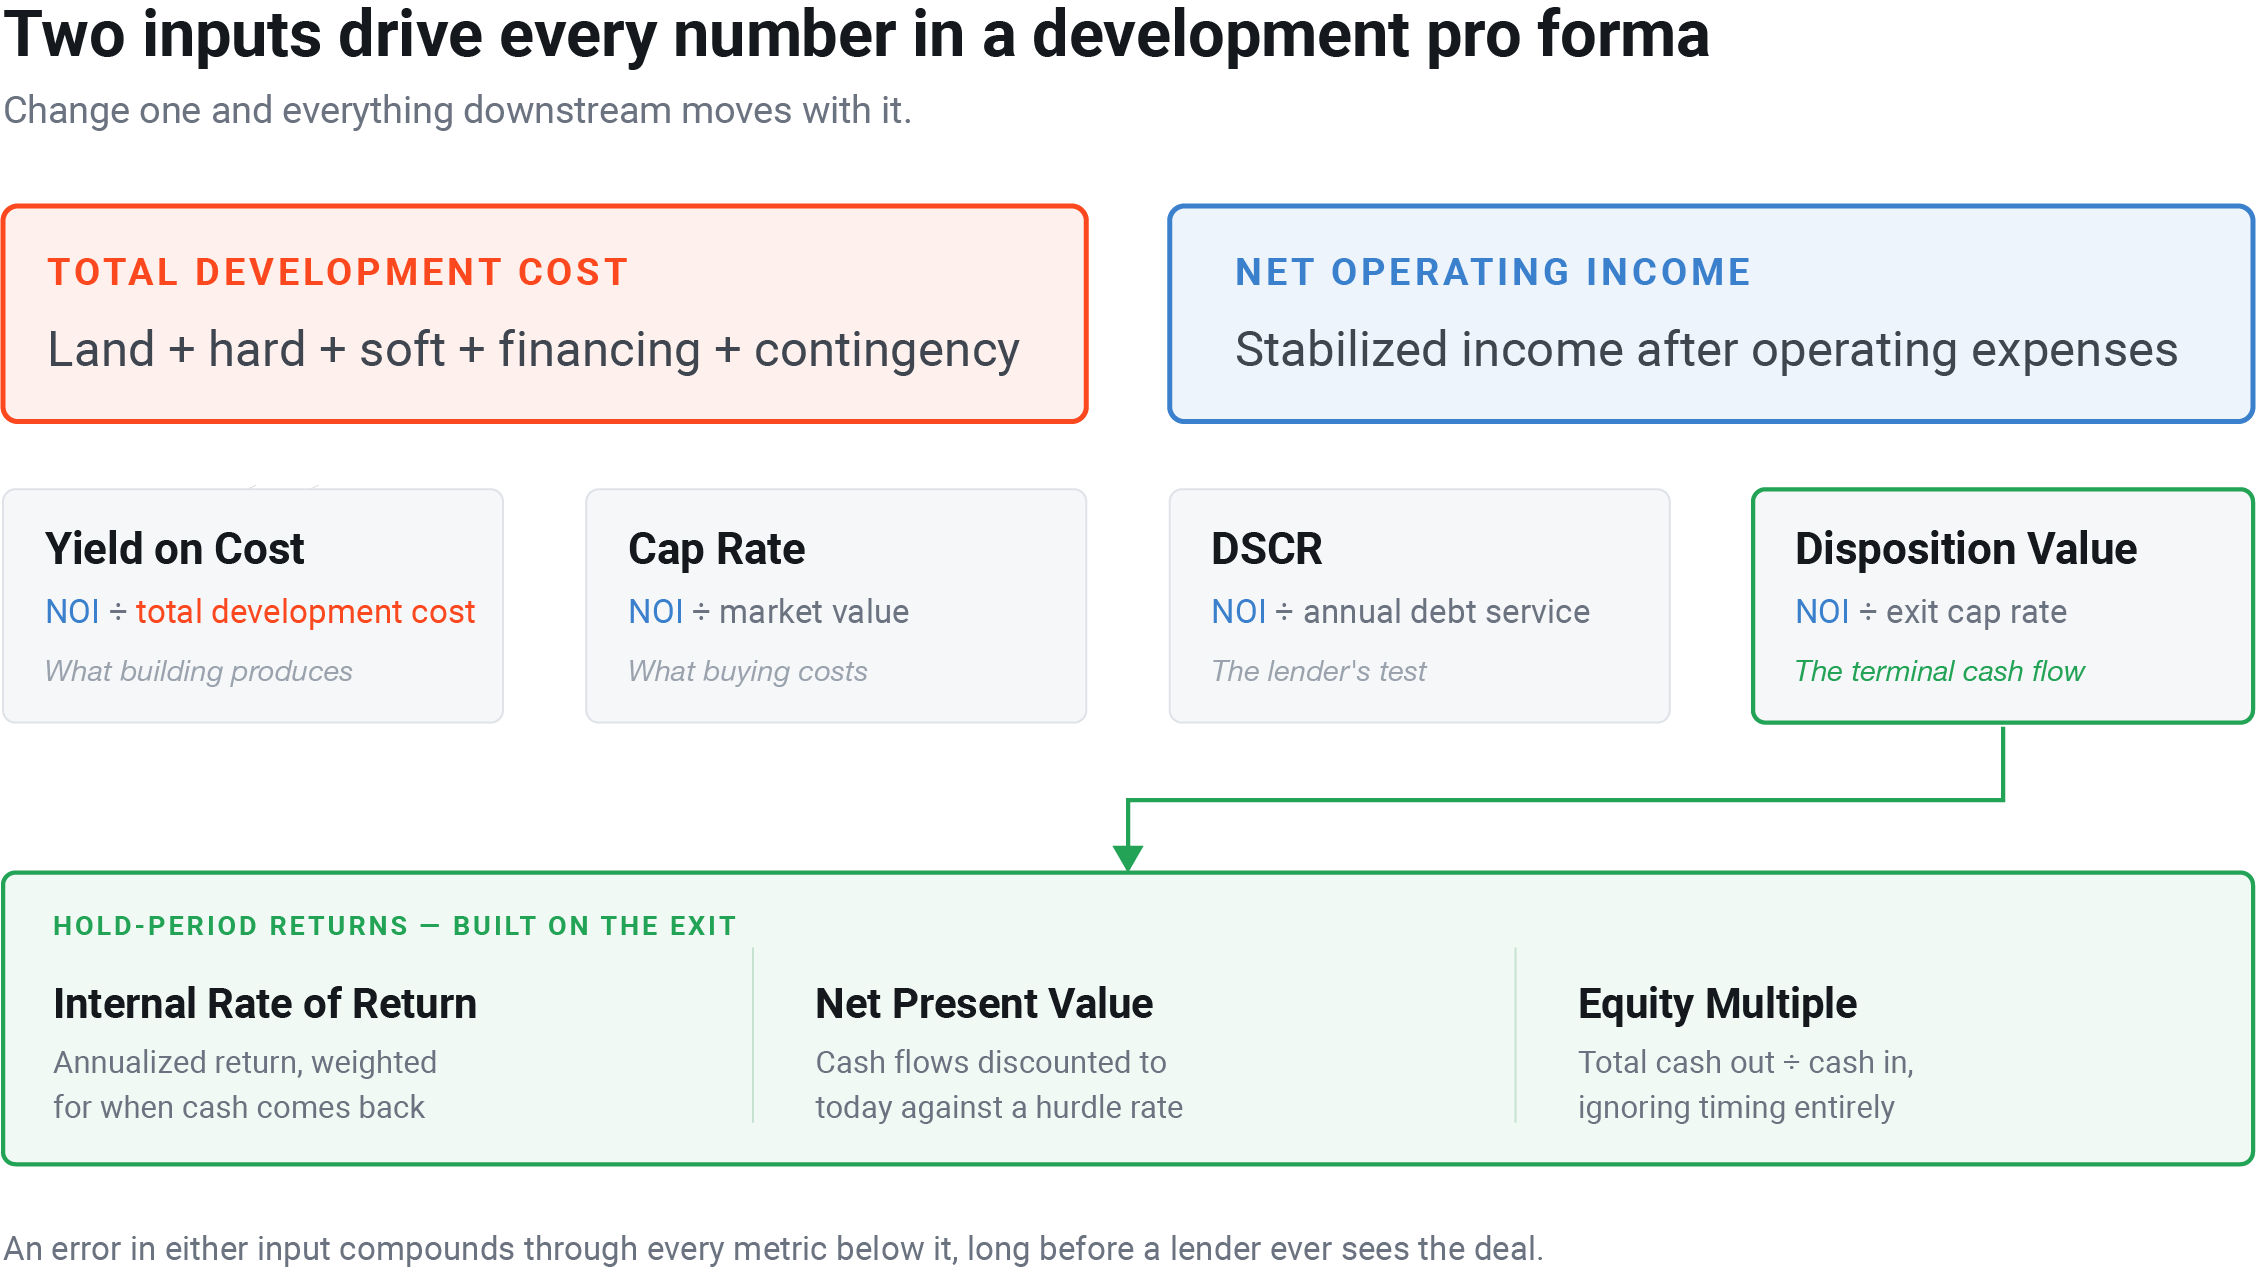
Net Operating Income, or NOI, is the income a stabilized property generates after operating expenses, before debt service or capital expenditures. It's the number every other metric on this list ultimately depends on: yield on cost divides it by total development cost, cap rate divides it by value, and DSCR sizes a loan against it. Get the NOI projection wrong, on rent assumptions, vacancy, or operating expense ratios, and every metric downstream inherits that error.
Yield on Cost
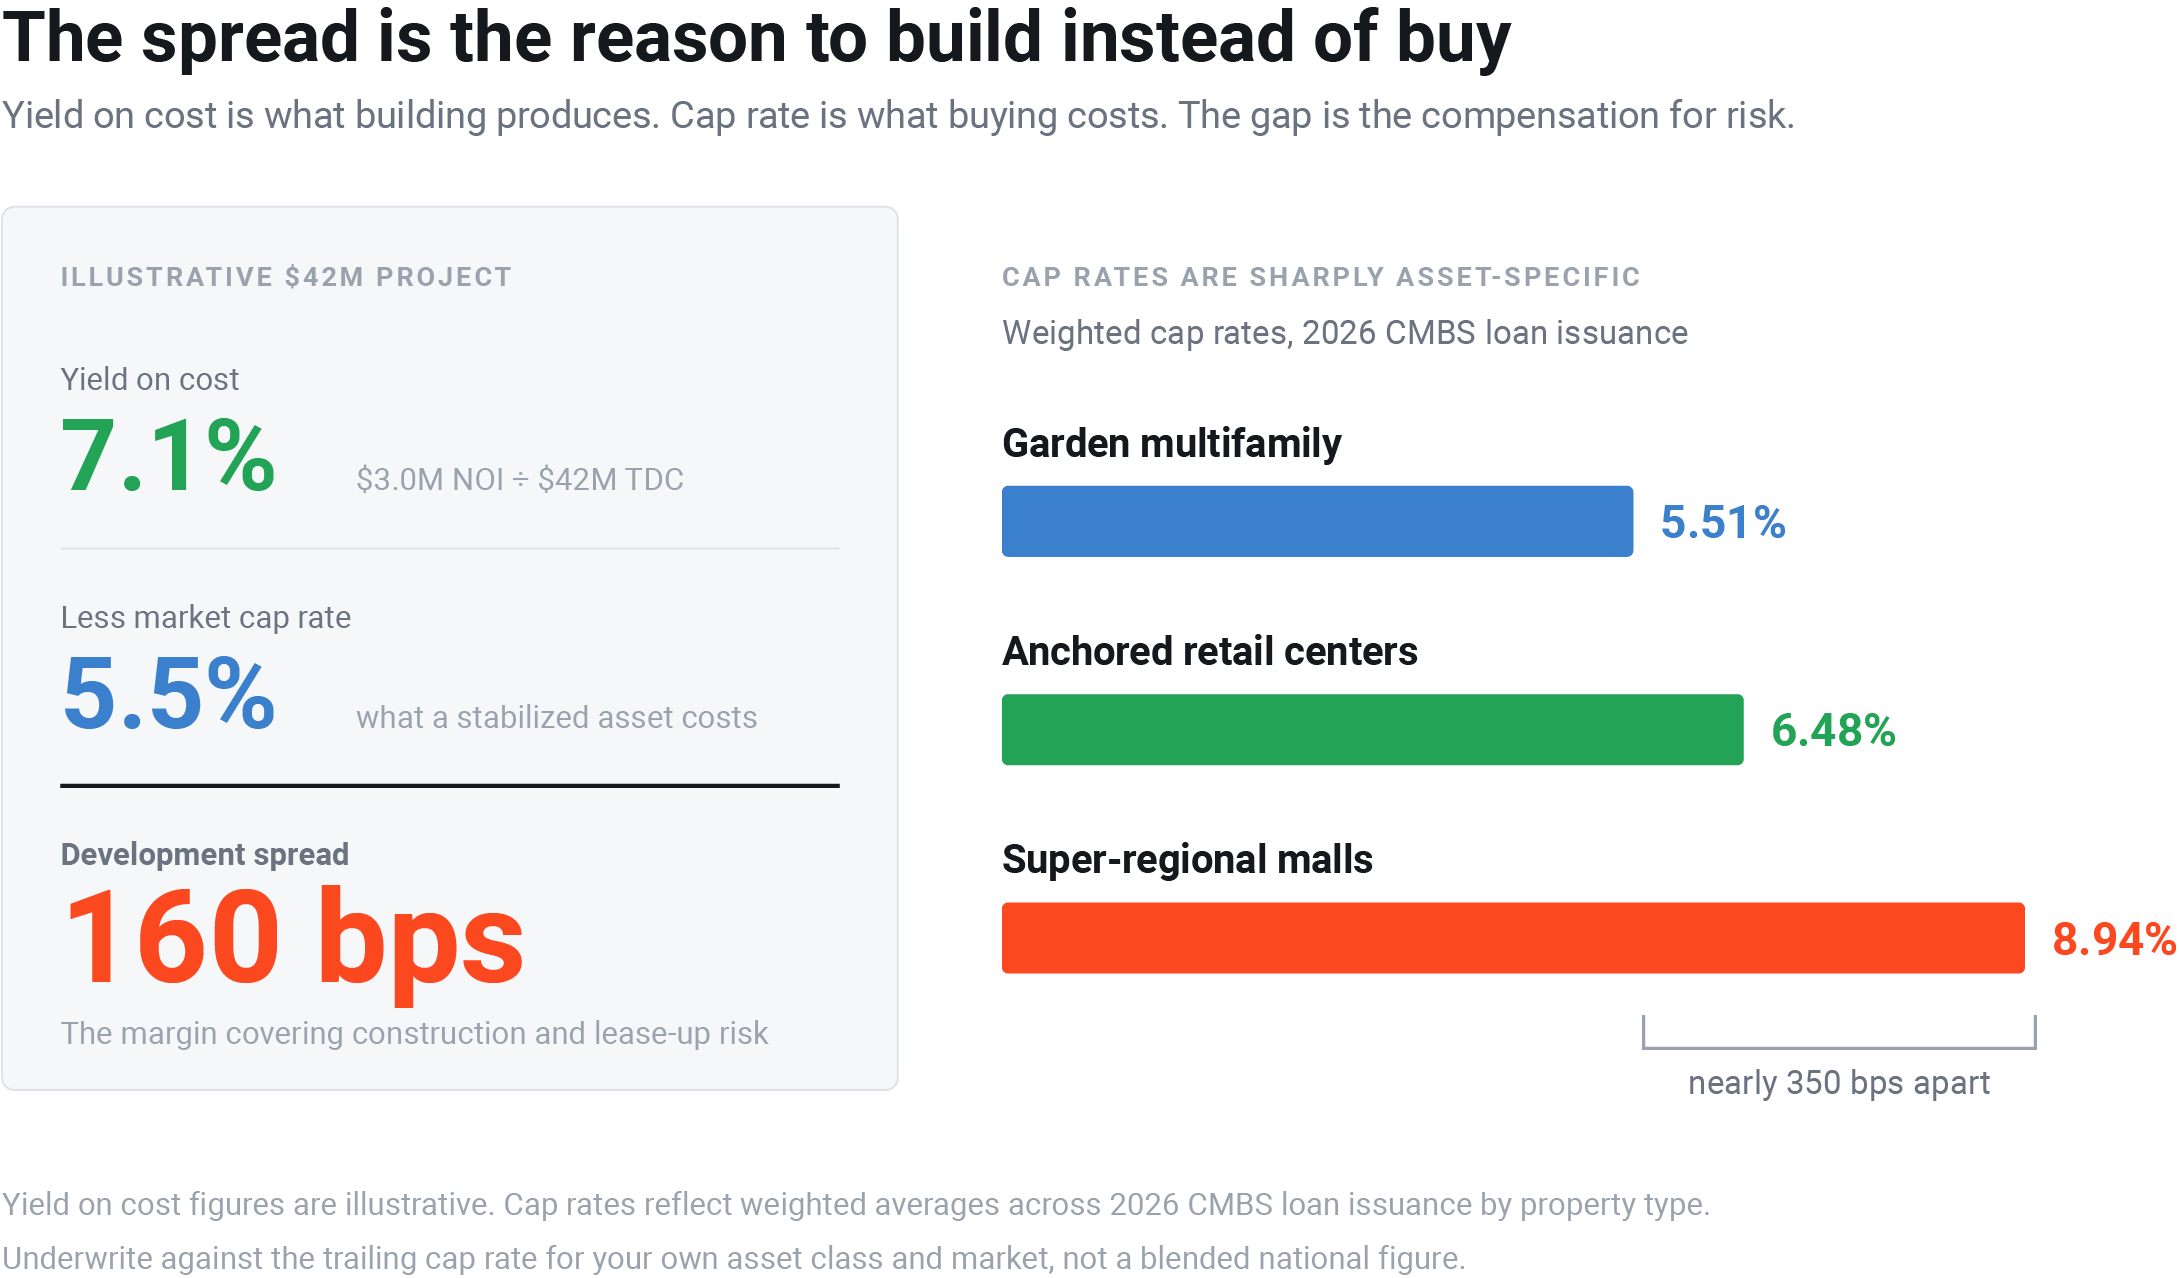
Yield on Cost divides a project's net operating income by its Total Development Cost. Using the example above, if that forty-two million dollar project generates three million dollars in stabilized NOI, the yield on cost comes out to roughly 7.1 percent. This is the single most important number in ground-up development, because it answers the question buy-and-hold metrics cannot: does building this asset from scratch produce a better return than simply buying a finished one in the same market.
Cap Rate
Cap rate answers the buying side of that comparison. It is a property's NOI divided by its purchase price or current market value, and it moves with the market rather than with a construction budget. Cap rates are also sharply asset specific. Commercial Observer's analysis of 2026 CMBS loan issuance found garden multifamily properties trading at a weighted cap rate of 5.51 percent, while super-regional malls priced nearly 350 basis points higher at 8.94 percent, with anchored retail centers landing in between at 6.48 percent. Comparing a project's yield on cost to the prevailing cap rate for its asset class and market is the whole point of underwriting the deal in the first place.
Disposition Value
Disposition Value is what the finished, stabilized asset is projected to sell for once the project is complete and leased up. It's typically estimated by dividing projected stabilized NOI by a forward exit cap rate, often set slightly higher than today's cap rate to account for the uncertainty of underwriting several years out. Using the example above, that three million dollars in stabilized NOI valued at a 5.5 percent exit cap rate works out to a disposition value of roughly fifty-four and a half million dollars. CBRE's 2026 market outlook projects cap rates across most property types to fall five to fifteen basis points this year, with compression concentrated in higher-quality assets, which is exactly why building a cushion into the exit cap rate is the conservative move rather than betting today's pricing holds for years. Disposition value is the terminal cash flow that IRR and NPV are built around, which makes it the number that ultimately proves out, or disproves, a development's viability.
Internal Rate of Return
Internal Rate of Return, or IRR, is the annualized return a project generates once every cash flow, in and out, across the entire hold period is accounted for. Unlike yield on cost or cap rate, which are point-in-time snapshots, IRR captures timing. A dollar returned in year two is worth more than the same dollar returned in year seven, and IRR is built to reflect that difference. It is the metric most equity partners ask for first, because it is the one that lets them compare a real estate deal against every other place their capital could go.
Net Present Value
Net Present Value, or NPV, takes every projected cash flow from a deal, discounts it back to today's dollars using a chosen hurdle rate, and subtracts the initial investment. A positive NPV means the project clears the bar an investor set for themselves. A negative NPV means it does not, no matter how strong the headline IRR looks. NPV and IRR are close cousins, and most underwriting models run both side by side so one can catch what the other might mask.
Equity Multiple
Equity Multiple measures total cash returned to an investor divided by total cash invested, across the entire hold period, regardless of when those dollars came back. If a five million dollar equity investment returns eight million dollars total by the time the asset sells, that's a 1.6x equity multiple. It's a useful companion to IRR, since IRR can look inflated on a deal that returns capital quickly even when the total dollar return is modest, while equity multiple keeps that number honest by showing the total volume of cash that moved.
Debt Service Coverage Ratio (DSCR)
Debt Service Coverage Ratio, or DSCR, is the lender's coverage test: net operating income divided by annual debt service, the loan's principal and interest payments. A property with three million dollars in NOI and annual debt service of 2.2 million dollars has a DSCR of about 1.36x. Lenders typically require a DSCR comfortably above 1.0, often in the 1.20x to 1.35x range depending on asset class and loan type, to make sure a property's income covers its debt payments with room to spare. It's the test a deal has to clear to get financed at all, before yield on cost or cap rate ever enter the lender's side of the conversation.
Cash on Cash Return
Cash on Cash Return is a narrower, equity-level metric: annual pre-tax cash flow divided by the actual cash invested, not the full capital stack. If an investor puts in five million dollars of equity and the project distributes four hundred thousand dollars in year one, that is an 8 percent cash-on-cash return. It ignores leverage, appreciation, and exit value entirely, which makes it a poor stand-in for total return. It also doesn't tell you much until a project is stabilized, since there's no cash flow to measure during construction and lease-up, so treat it as a secondary check once a property is operating rather than a metric to underwrite the deal on up front.
None of these ten terms is complicated on its own. What makes development math hard is that all of them move together, and a change in one, a construction cost overrun, a softening exit cap rate, a lender tightening its DSCR requirement, ripples through the rest before a project ever breaks ground. Most teams still work this out in a static spreadsheet that gets built once at the LOI stage and rarely gets touched again until the numbers stop working. Knowing these terms cold is what lets a team catch a deal that does not pencil while there is still time to change the plan, not after the site work has started.
Before the next deal lands on your desk, run this instead of skimming past it: pull the trailing cap rate for the asset class and market you're underwriting, set it against your projected yield on cost, and see what spread you're getting paid to build instead of buy. If that spread isn't working, that's worth a conversation before a site plan gets drawn, not after construction starts. Schedule time with our team to walk through your pro forma and see where generative design can help you test it against the design in real time.