.svg)

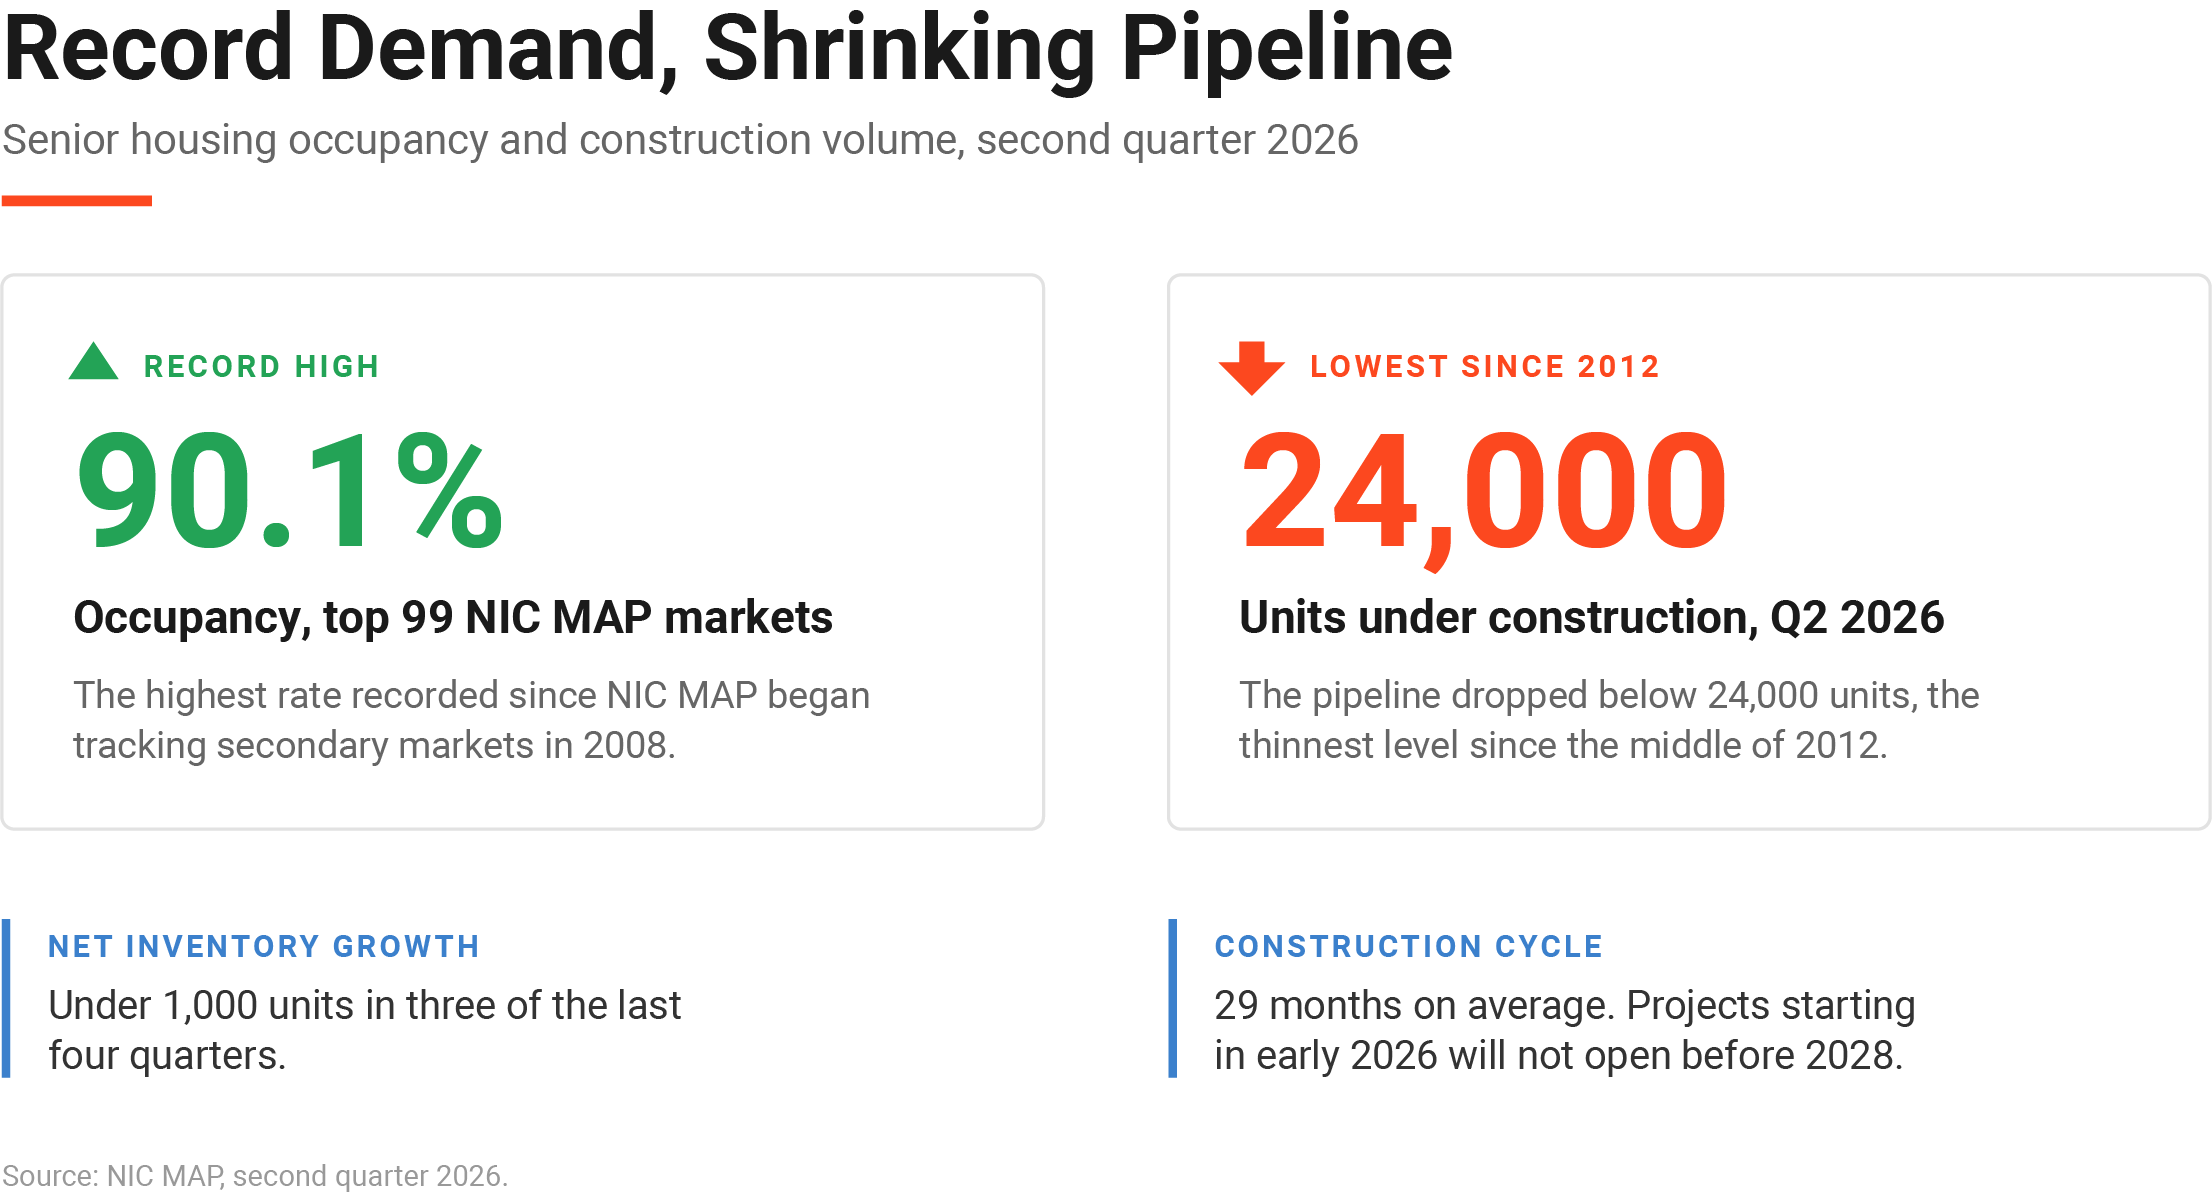
Senior housing occupancy across the top 99 metro markets tracked by NIC MAP hit 90.1 percent in the second quarter of 2026, the highest rate ever recorded since NIC MAP began tracking secondary markets in 2008. At the same time, units under construction fell below 24,000, the lowest level since mid-2012. Record demand and a shrinking pipeline is usually the setup for a building boom. Not here. People clearly want this product. The harder question for anyone underwriting senior housing feasibility right now is why so few of these deals are getting built anyway.
The Demand Side Isn't the Problem
The first members of the postwar baby boom turned 80 in 2026, roughly the age at which most people who move into senior housing make that move. The average construction cycle for a senior housing project has stretched to 29 months, meaning projects breaking ground in early 2026 won't open before 2028, according to NIC's head of research and analytics, Lisa McCracken. Net inventory growth has been under 1,000 units in three of the last four quarters. Demand isn't the constraint. A pipeline that can't keep pace with demand this badly usually comes down to deals that don't pencil, and in senior housing that math starts with a number most feasibility conversations skip past entirely: how much of the building generates rent.
Senior Housing Feasibility Runs on a Number Multifamily Doesn't Carry
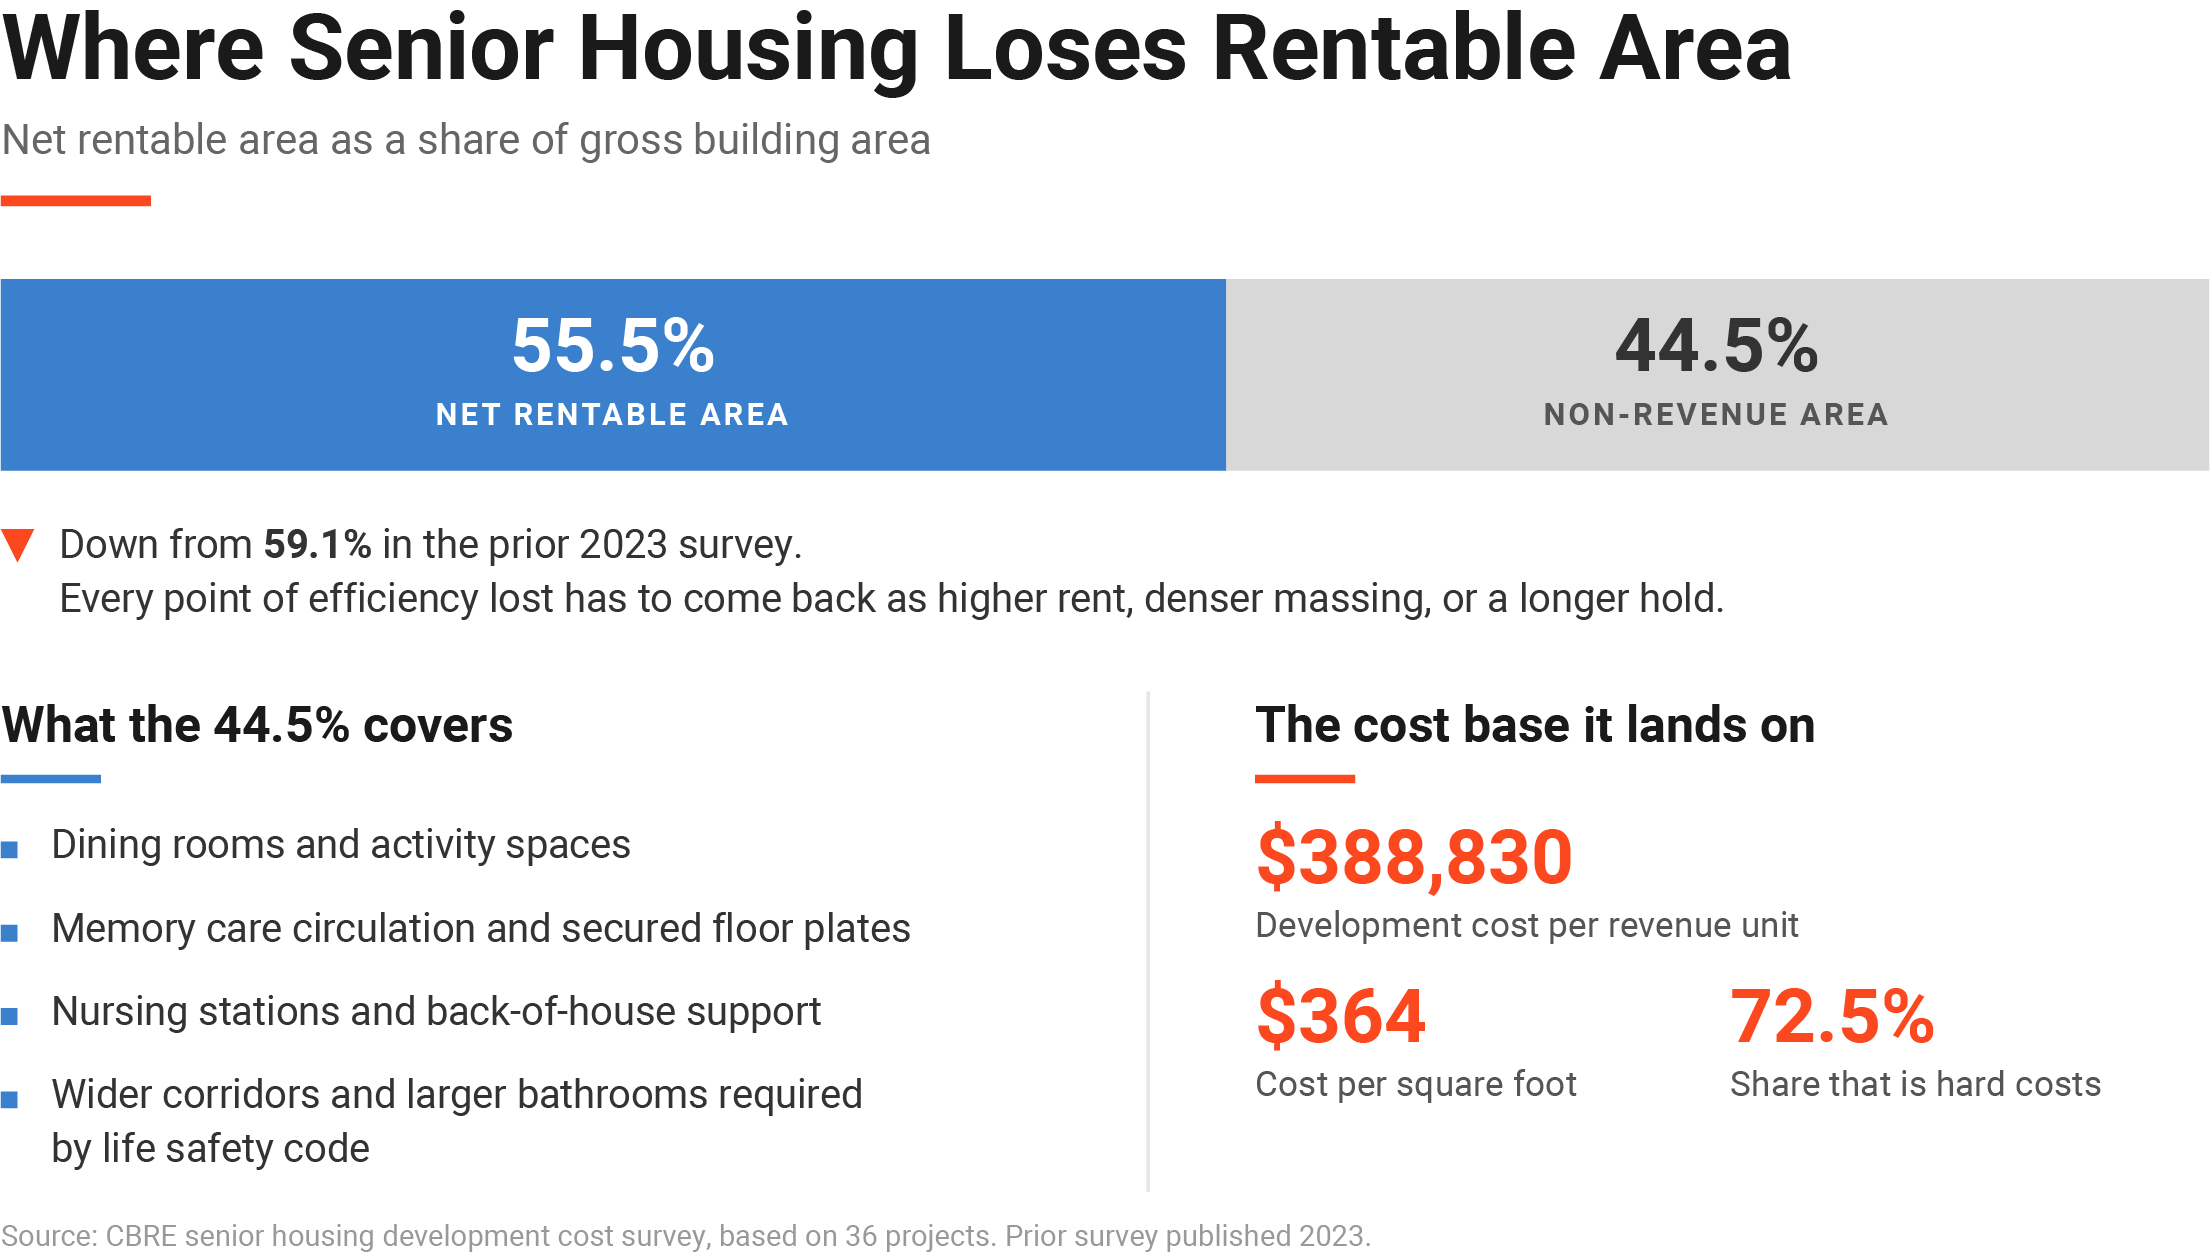
In a typical multifamily deal, the ratio of net rentable area to gross building area is a design detail worth a percentage point or two. In senior housing, it is close to the whole ballgame. CBRE's most recent development cost survey, based on 36 projects, found net rentable area averaging 55.5 percent of gross building area, down from 59.1 percent in the firm's prior 2023 survey. The other 44.5 percent, dining rooms, activity spaces, memory care circulation, nursing stations, back-of-house support, and the wider corridors and larger bathrooms that life safety code requires for residents using walkers and wheelchairs, is the cost of the care model. Code requires it, and it comes directly out of the area you can charge rent on.
That efficiency loss lands on a cost base that has already moved. The same survey put average development cost at $388,830 per revenue unit, or $364 per square foot, with hard costs alone making up 72.5 percent of that figure. Cap rates on stabilized senior housing assets rose to 7 percent in the second quarter of 2026 from 6 percent in 2023, which pulled average return on cost down to 8.1 percent from 8.2 percent even as rents kept climbing. The same yield on cost versus cap rate spread decides whether any deal gets built at all, and senior housing runs on worse terms than most other product types because the building starts at a structural discount other asset classes don't carry. Every point of net-to-gross efficiency a site loses has to come back somewhere else in the math: higher rents, denser massing, or a longer hold. None of those are free.
Lenders feel this ratio before anyone else does. A loan is sized off projected net operating income, and net operating income only counts square footage that generates rent. A site plan that delivers 50 percent net-to-gross instead of 55.5 percent shrinks more than the developer's return. It shrinks the loan amount a bank will underwrite against the same land and construction budget, because the debt service coverage ratio, the metric lenders use to confirm a property's income can cover its loan payments, gets calculated against that same constrained revenue base. The site plan has to come before the capital stack conversation.
The efficiency problem also isn't uniform across care levels. Memory care wings need smaller, more secured floor plates with more distance between residents, both for staff supervision and to avoid overstimulating people living with dementia. Griffin Living CEO Paul Griffin III has described sizing memory care wings at roughly a third the unit count of the assisted living product they sit alongside, since stretching staff and shared space much further than that stops working. A generic multifamily floor plate was never built to absorb that kind of care-specific circulation requirement. A project blending independent living, assisted living, and memory care on one site is really underwriting several different efficiency curves stacked on top of each other.
Why the Site Decides the Efficiency Number
Senior housing feasibility can't start with a spreadsheet. The net-to-gross ratio gets set by the site plan, months before anyone finalizes a pro forma. A clean, regular parcel lets a double-loaded corridor run the full length of a building, which keeps circulation short and rentable area high. A constrained or oddly shaped site, the kind of geometry problem that shows up constantly in the greenfield versus brownfield tradeoffs that shape every product type, forces bent floor plates and longer corridors. In multifamily, that mostly shows up as a slightly worse cost per square foot. In senior housing, where circulation is already competing with dining, activities, and care space for a share of the building, a difficult site plan can turn a marginal deal into one that never clears its numbers.
Parking is one of the few places senior housing gets room back. The Institute of Transportation Engineers' own studies put peak parking demand for independent senior housing at roughly 0.6 spaces per unit, well under the 1.5 to 2.0 spaces per unit that market-rate garden apartments typically require. That difference can free up real building footprint on a constrained site, but only if the site plan gets tested early enough to take advantage of it. A parking ratio locked in late, out of caution or habit, gives back the efficiency the rest of the building is fighting to keep.
A few operators are moving anyway. Belmont Village has continued advancing new high-end development with partners including Turnberry, betting that a premium product on the right site can clear the numbers even as construction costs climb. Getting there took running the numbers against a specific building and a specific site early, before capital committed, rather than assuming a strong address would carry a floor plate that fights the site.
What Senior Housing Feasibility Means Before You Commit to a Site
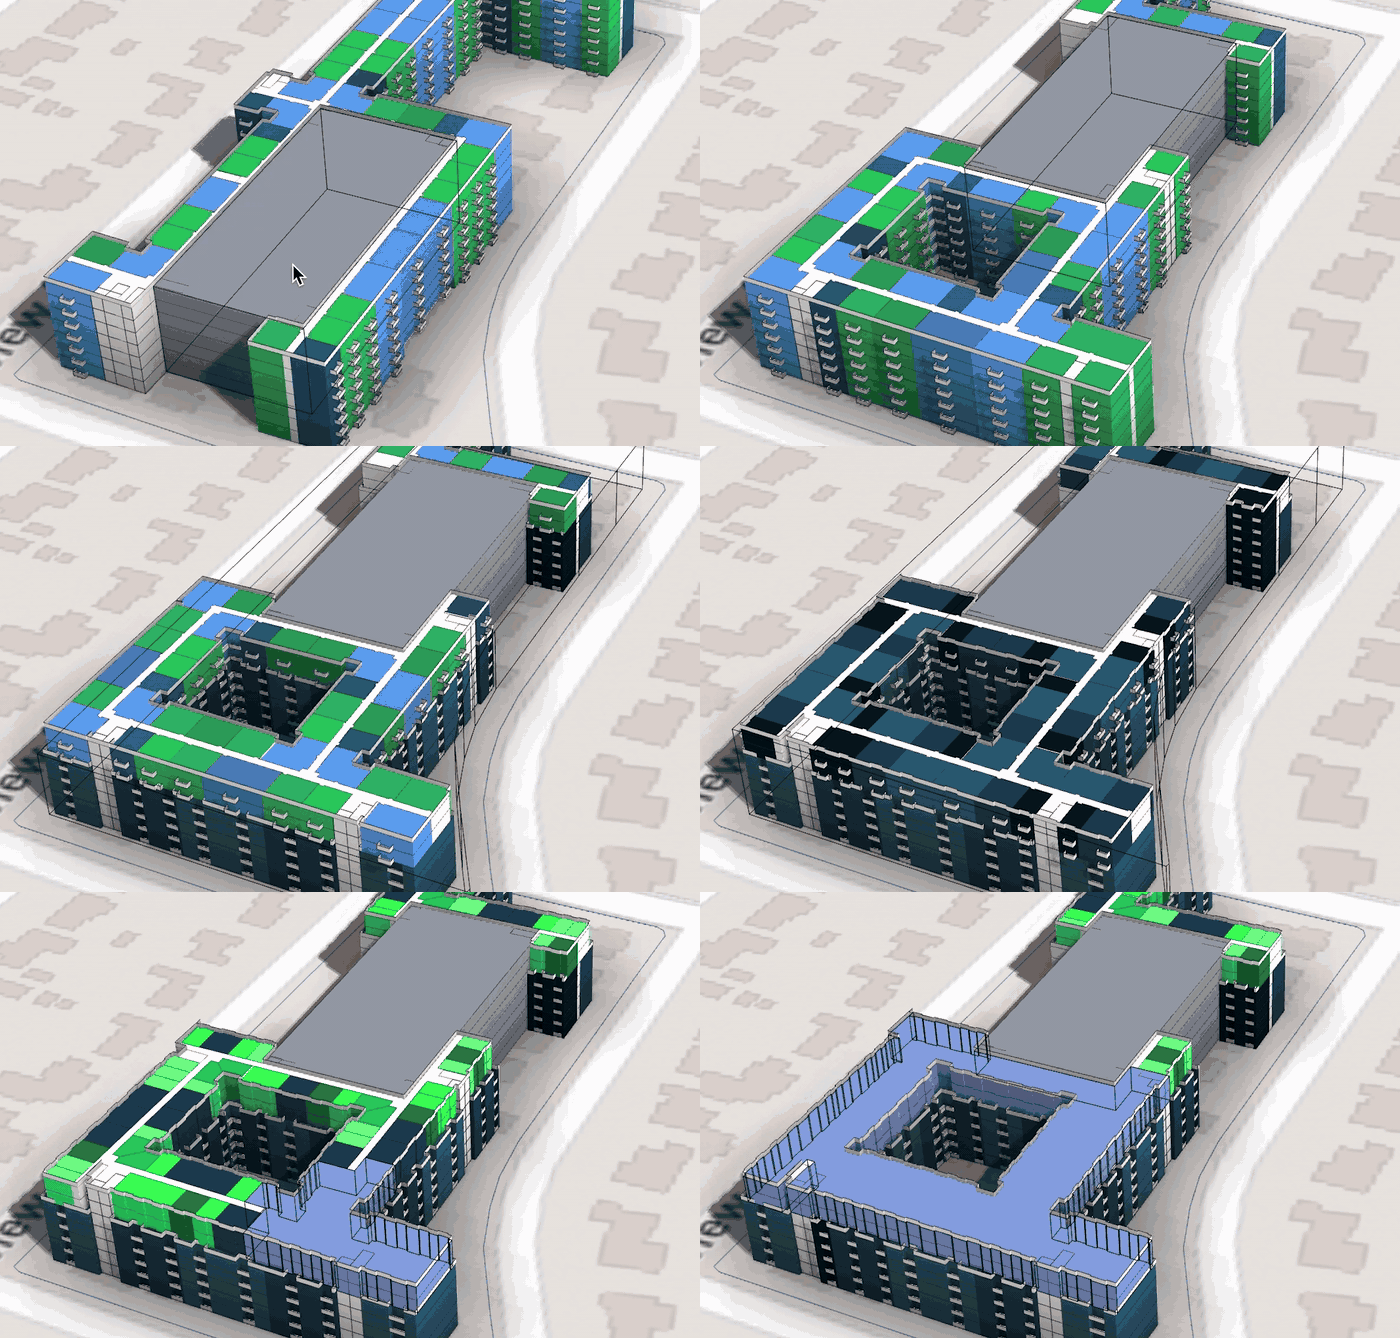
The supply gap is real. Operators who figure out how to build efficiently into it are the ones positioned to absorb the demand NIC MAP keeps reporting quarter after quarter, and figuring that out starts with the building, not the market assumptions. A unit count, a parking ratio, a rough net-to-gross estimate, and a preliminary construction cost, run against a specific parcel and zoning envelope, can show in hours whether a concept holds up. That work used to take weeks. By the time it was done, a developer had often already tied up earnest money on a site whose geometry was never going to support the unit count the deal needed.
Software built for this stage of the process exists because that gap, between a napkin unit count and a fully worked floor plate, is where a lot of senior housing deals get committed before anyone has confirmed the site can deliver the efficiency the pro forma is counting on. Occupancy near 90 percent and a shrinking pipeline already make senior housing about as favorable as commercial real estate fundamentals get right now, and the demographic wave behind both numbers has only started arriving. Whether
a given deal gets built into that opportunity comes down to whether someone stress-tested the massing early enough to know the building could deliver what the numbers needed.
Test the Site Before You Commit to the Deal
TestFit's Site Solver checks unit count, care mix, parking, and cost against your parcel in minutes, so you know where the numbers land before you're committed to the site.
→ Talk to the team about your next senior housing site