
The site looks promising, the program makes sense, the pro forma is taking shape, and the question on the table is simple: Does it have legs?
Yield on cost separates a viable development from a value trap. It tells a developer whether the time, capital, and risk of building something new will produce a return strong enough to justify the effort, especially compared to simply buying an existing asset.
Here is what yield on cost is, why it matters more in some markets than others, and where in the feasibility workflow it gets won or lost.
What yield on cost measures
Yield on cost is a return metric. The formula is straightforward:
Yield on Cost = Stabilized Net Operating Income ÷ Total Project Cost
Net operating income (NOI) is the income the asset is expected to produce once it is built, leased, and operating at a stabilized level. Total project cost includes land, hard costs, soft costs, financing costs, and any reserves needed to get the asset to that stabilized state.
Some developers run two versions:
- Untrended yield on cost uses today's rents and today's costs, with no inflation assumptions baked in.
- Trended yield on cost projects rents forward to delivery and stabilization, accounting for expected rent growth.
Untrended is the more conservative, and increasingly the version capital partners want to see first.
Yield on cost vs cap rate
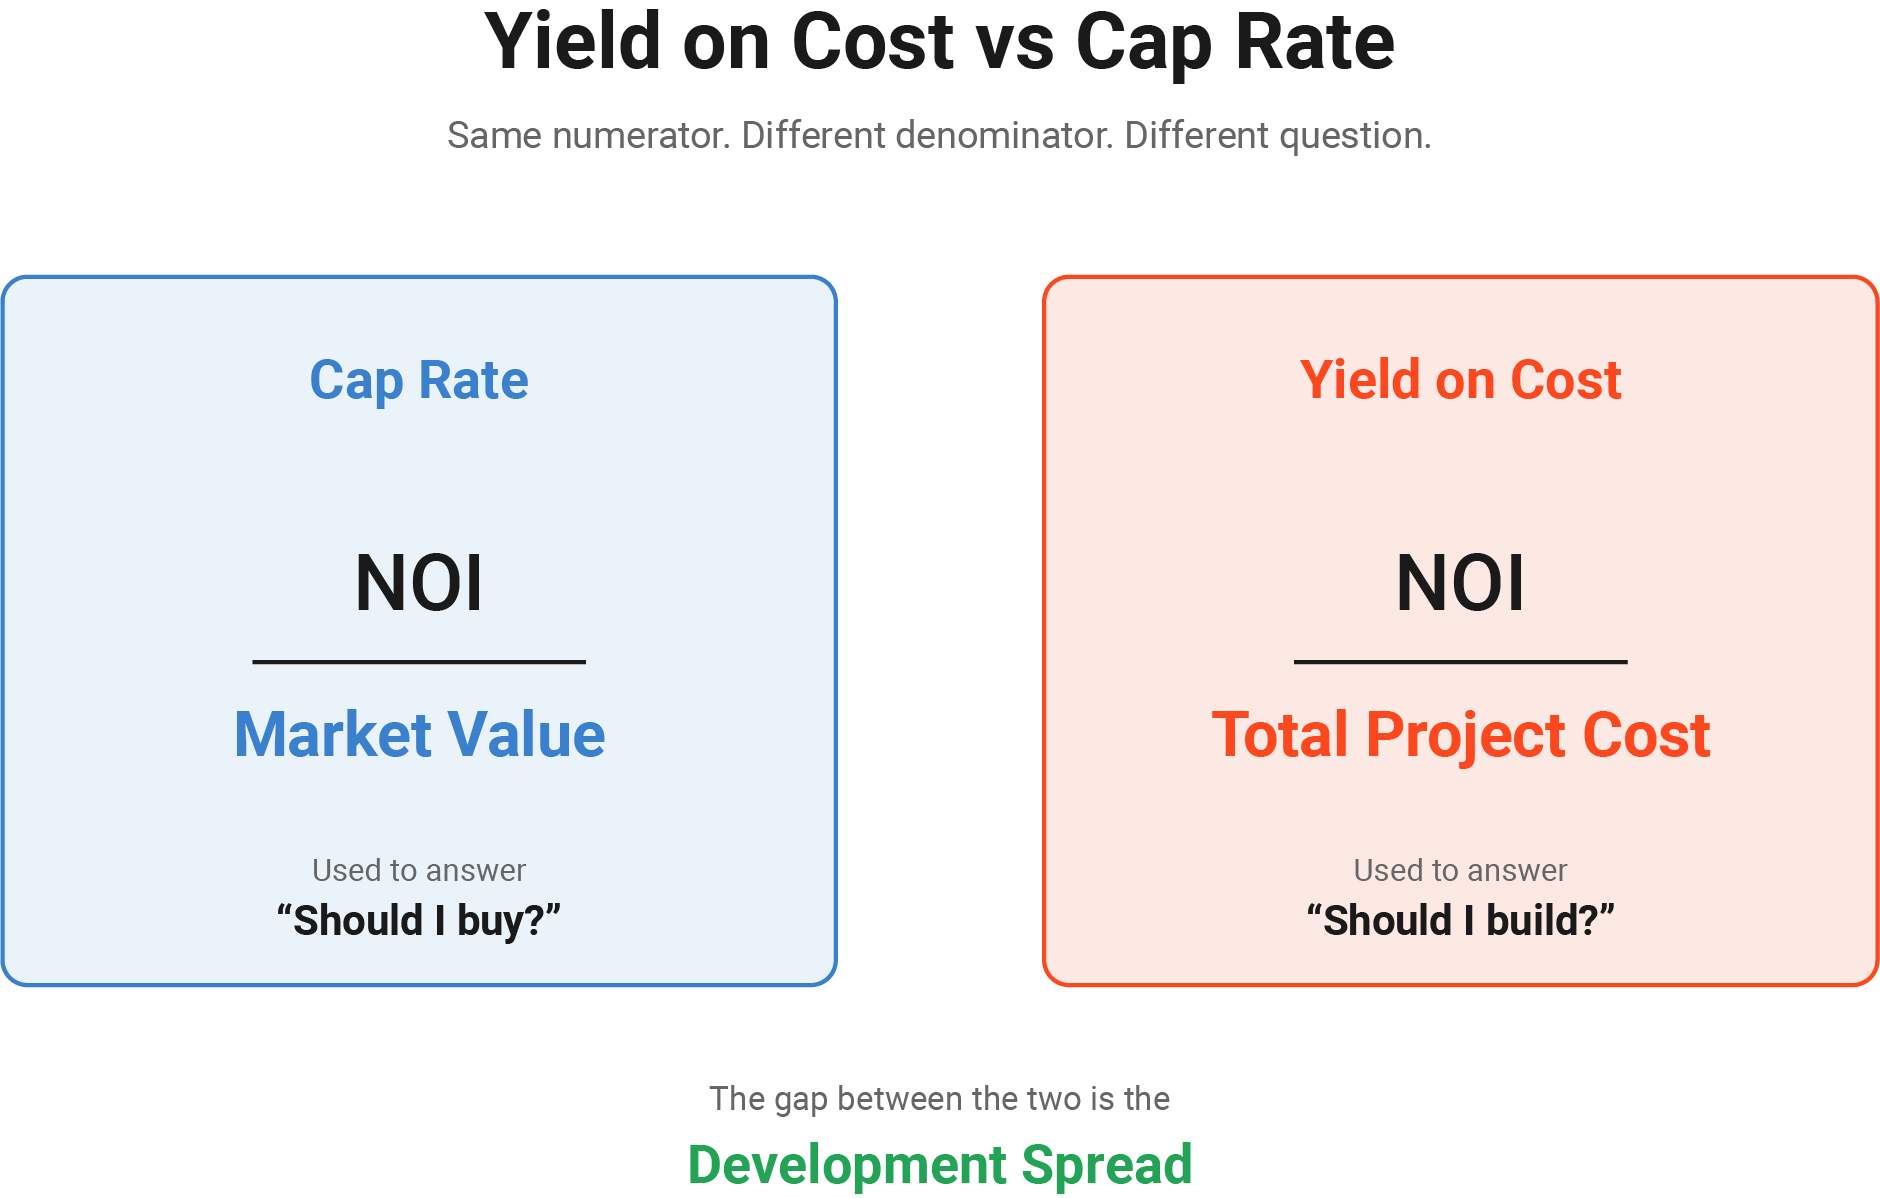
Yield on cost and cap rate look almost identical on paper. Both put NOI in the numerator. The difference is what sits in the denominator, and that difference changes everything.
Cap Rate = Stabilized NOI ÷ Market Value
Yield on Cost = Stabilized NOI ÷ Total Project Cost
A cap rate measures what an existing, stabilized building yields at the price it would trade for today. It moves with the market. When investor demand surges, cap rates compress. When capital pulls back, they expand. The number tells a buyer what return they can expect by acquiring a stabilized asset.
Yield on cost measures what a project produces relative to the actual capital required to build or reposition it. It is anchored in the project's cost basis, not in market sentiment. Two identical buildings sitting next to each other can trade at the same cap rate while having very different yields on cost, because one was built cheaper, sooner, or with a more efficient program than the other.
That is why developers underwrite to yield on cost and investors trade on cap rates. The two numbers answer different questions: should I build, or should I buy?
The relationship between them is what defines the development spread.
Why the spread matters more than the number
The development spread is the gap between a project's yield on cost and the market cap rate for comparable stabilized assets. It is the number capital markets actually care about, because it measures the value created by developing rather than buying.
If a multifamily project pencils to a 6.0% yield on cost in a market where comparable assets trade at a 5.0% cap rate, the spread is 100 basis points. That spread represents the development premium the project earns for taking on construction and lease-up risk.
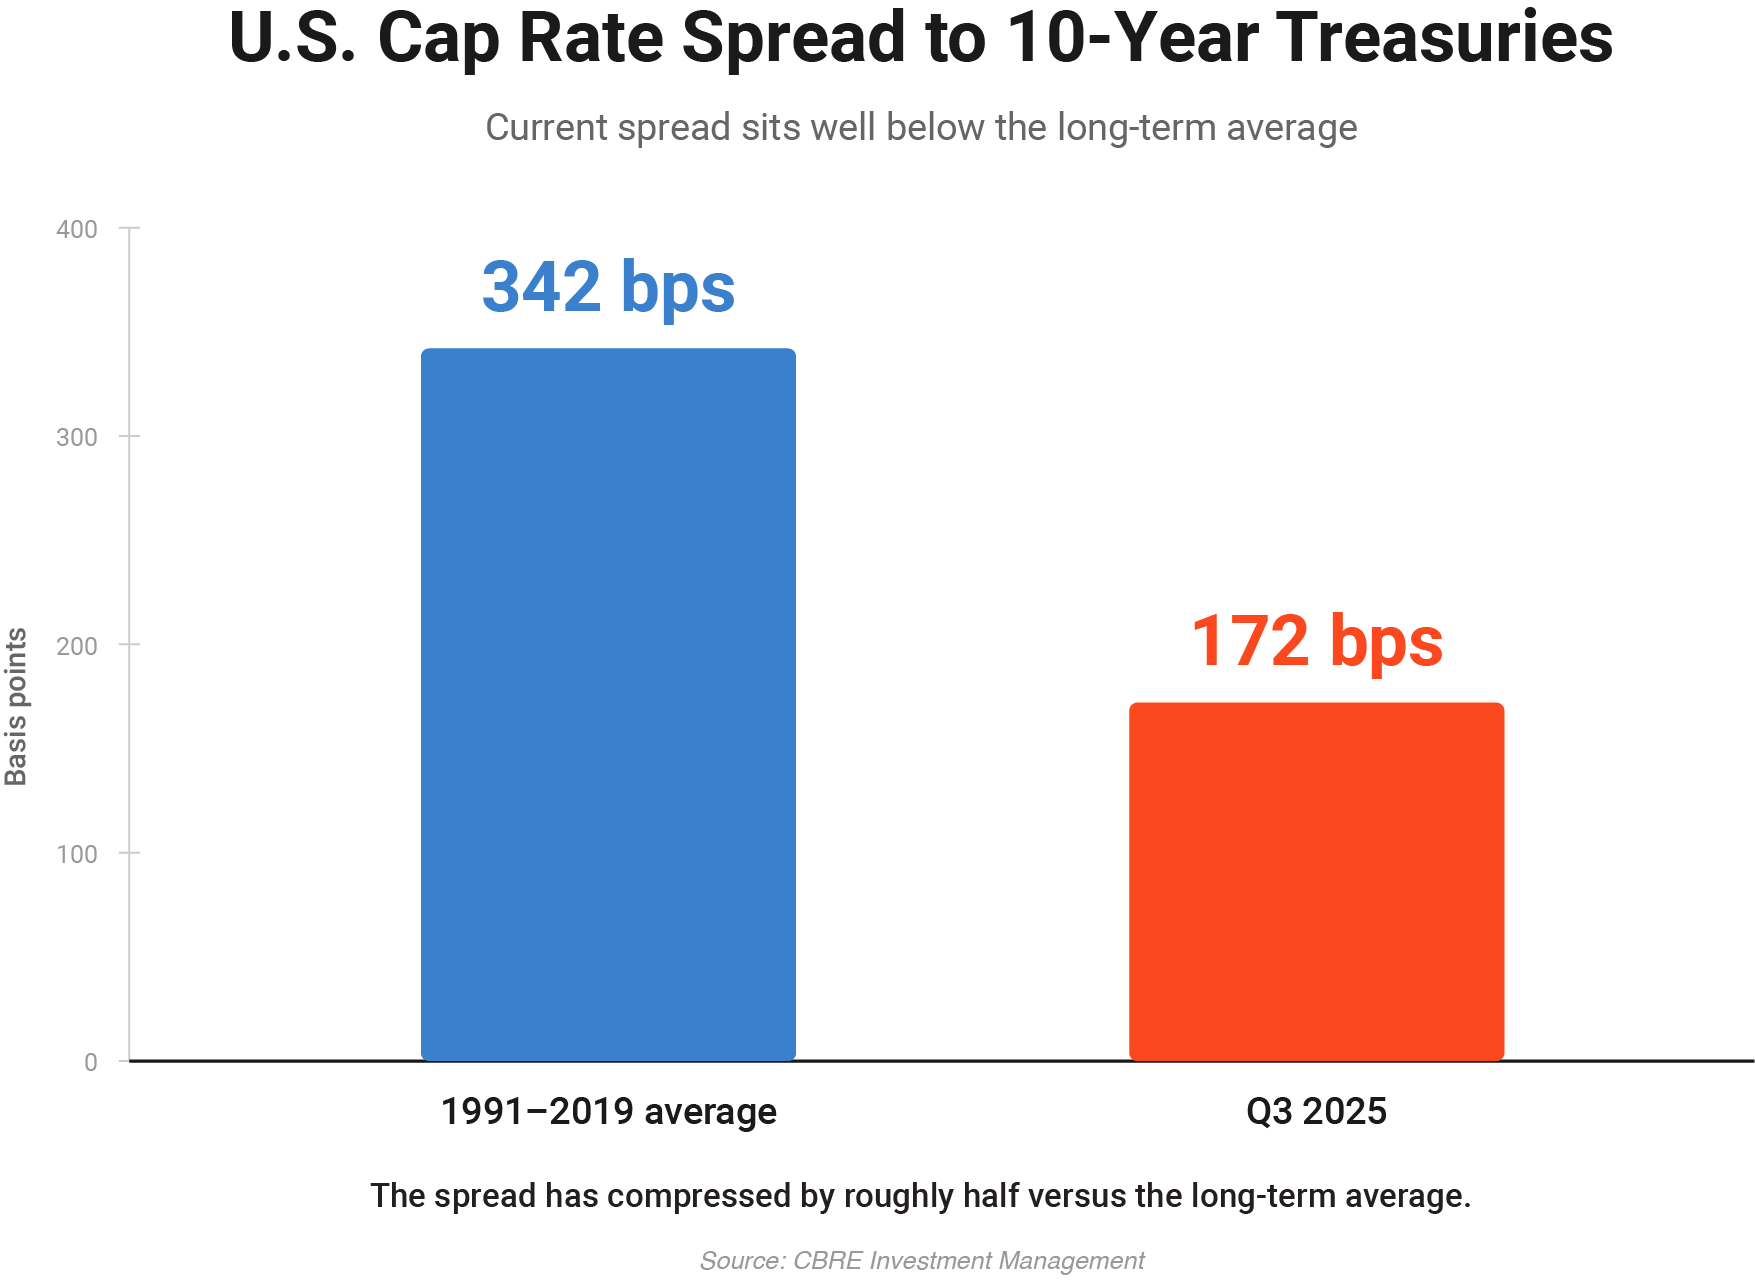
Historically, a healthy spread for multifamily and industrial development has typically been measured in the range of 150 to 250 basis points, though benchmarks shift with the cycle and the asset class. When construction costs rise, interest rates climb, or cap rates compress, that spread narrows fast. According to CBRE Investment Management, the U.S. cap rate spread to 10-year Treasuries sat at 172 basis points as of Q3 2025, well below the 342-basis-point average from 1991 to 2019. That kind of broad yield compression squeezes development spreads downstream. Deals that penciled twelve months ago suddenly do not.
Which is why yield on cost has become the single most-watched metric in development right now.
Where yield on cost is won or lost
The temptation is to treat yield on cost as a back-end calculation, something the pro forma spits out after the design is finalized. In practice, the number is decided much earlier.
Three inputs drive it:
- Program efficiency. How many leasable units, square feet, or rentable bays fit on the site, and at what unit mix.
- Cost discipline. What the structure, parking, and site work actually cost to deliver.
- Achievable rents. What the market will pay for the program being designed.
The first two are largely set during feasibility. By the time the design enters DD, most of the cost and yield ceiling is already locked in. Developers and architects who consistently hit their target yields are the ones who run more scenarios earlier, with better data attached to each one.
The case for testing more scenarios
The arithmetic is simple. A subdivision that yields 110 lots instead of 95, on the same site and within the same setbacks, can change a marginal deal into a strong one. A multifamily program that finds 12 more units by reorganizing parking or the core can shift the yield on cost by 30 to 50 basis points.
Those gains are not found by drawing one option carefully. They are found by drawing twenty options quickly, with pro forma feedback running alongside the design. (For a deeper look at the levers that move unit yield, see Boosting Building Unit Yield 101.)
How TestFit fits into the yield on cost workflow
TestFit is built around this exact problem. Site plans, unit mixes, and parking layouts solve in seconds rather than days, which means feasibility teams can stress-test dozens of scenarios on a single site. The Cost Model attaches realistic cost data to each iteration, and the embedded pro forma in Site Solver links those costs directly to NOI projections in a single live-updating view. As the workflow piece on Deal Information Modeling puts it, yield on cost becomes available in seconds, not weeks.
The result is that yield on cost stops being a number calculated at the end of feasibility and becomes a number designed against from the start.

How AC Martin used TestFit to rethink yield studies
AC Martin, one of the oldest architecture firms in California, rebuilt its multi-family yield study process around this principle. Sami Khoury, Principal, began running TestFit live during initial client calls, inputting target unit counts, mix percentages, and site-specific requirements while the conversation was still in progress. Floor plans, 3D massing, and project metrics updated in real time as assumptions changed.
The outcome was measurable. AC Martin now produces 4x the number of design options per feasibility study and gets to the right scheme 6x faster. Clients see how each tradeoff affects the numbers as decisions are being made, rather than waiting weeks for a static deliverable. That kind of speed is exactly what allows a team to find the configuration that hits the target yield on cost rather than settling for the first one that fits the site.
The bottom line
Yield on cost is the metric that tells a developer whether the project being designed is worth building. The development spread is what tells the capital stack whether to fund it.
Both numbers move based on decisions made during feasibility, when the program, the parking, and the site layout are still flexible. Teams that can iterate fast, with cost and revenue assumptions tied to every iteration, are the ones whose deals keep penciling even as the market tightens.
Design Against Yield, Not After It
Yield on cost is won during feasibility, when the program and parking are still flexible. Link costs and NOI directly to your layout so the number updates as you design.