Waterfall Simulator
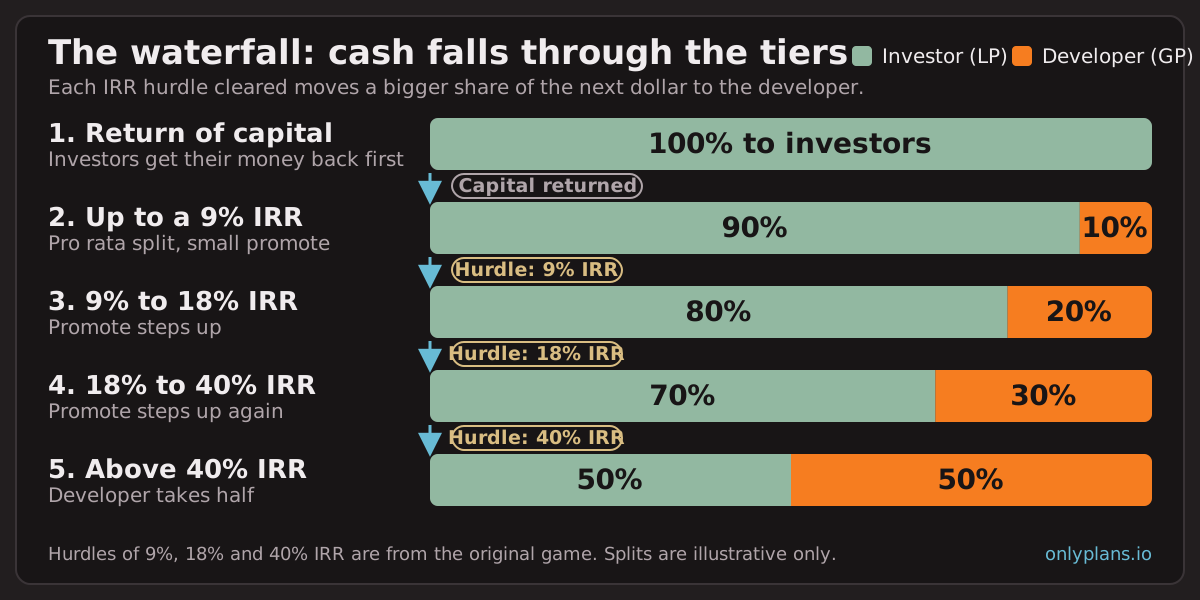
I really struggle to understand concepts modeled in excel–and furthermore, excel’s number based interface makes it hard for me to really understand exponential growth and magnitude of changes. Anyways, there is a financial mechanic in proformas called “The Waterfall” and it’s a simple incentive structure for developers to get a promoted interest in the cashflows of a real estate deal from their partners for outperforming their initial goal.
Anyways instead of building an infographic, or a large excel proforma to try to explain it…here is a very crude game. See if you can make a lot of $$ simply by buying hurdles in the right spot. This is NOT how the real world works.
Cheers
https://waterfawl.tiiny.site (link no longer active)
Who gets the next dollar?
One illustrative equity waterfall, paid once at the end of year three: return LP principal first; then pay a noncompounding preference on the original LP capital; then split excess cash between LP and GP. The LP supplies all equity and the GP receives only a promoted interest. Distributable cash is assumed net of operating costs, debt and selling costs. There is no GP catch-up, co-investment or additional hurdle. Actual agreements can use different payment order, compounding, IRR hurdles and tiers. Unpaid preference is shown separately from unrecovered principal.
The same mechanics, as arithmetic
That game, redrawn above, stacked three IRR hurdles at 9%, 18% and 40%. It is gone, so here are the mechanics without it.
A waterfall answers one question: when cash comes back from a deal, who gets the next dollar? There are two parties. The investors who supply the cash are the limited partners, LPs. The developer who finds the site and runs the job is the general partner, GP. The waterfall pays cash out between them in tiers, in order:
- Capital. The LP gets its original money back.
- Preferred return. The pref is what the LP collects before the GP shares in anything. Here it is 8% a year, simple, on the original capital.
- Split. Whatever is left is excess. The GP’s share of it, here 20%, is the promote: a cut of profit paid for performance rather than for money put in. Private equity calls the same thing carried interest.
Start small: $1M of LP capital, paid back once at the end of year three. Three years of pref is 8% × 3 × $1M = $240k, so the GP sees nothing until $1.24M has come back. In every row below, the first $1M returns the LP’s capital.
| Cash back | Pref paid | Excess | GP 20% | LP total |
|---|---|---|---|---|
| $1.5M | $240k | $260k | $52k | $1.448M |
| $1.24M | $240k | $0 | $0 | $1.24M |
| $1.2M | $200k | $0 | $0 | $1.2M |
Below $1.24M, capital plus pref, the developer is paid nothing, and every dollar of loss belongs to the LP, who put up every dollar.
The Financial Metrics deal
Financial Metrics ended on one deal. The owners put in $4M, take $300,000 a year, and sell in year five; repaying the $6M of debt leaves them $6M. That is $7.5M back, 1.875× their money and a 14.93% IRR. Here it is split on the same terms, assuming, as the simulator does, that the investors supply all $4M. Five years of 8% simple on $4M is a $1.6M pref, $320,000 a year, and each $300,000 check falls $20,000 short of it.
| Step | Cash | To the LP | To the GP |
|---|---|---|---|
| Five yearly checks | $1.5M | $1.5M, all pref; $100,000 still owed | $0 |
| Sale: capital back | $4M | $4M | $0 |
| Sale: rest of the pref | $100,000 | $100,000 | $0 |
| Sale: excess, 80/20 | $1.9M | $1.52M | $380,000 |
| Total | $7.5M | $7.12M: 1.78×, a 13.67% IRR | $380,000 |
The promote takes the investors from 1.875× to 1.78× and from a 14.93% IRR to 13.67%. Paying the pref out of the yearly checks rather than after capital, the simulator’s order, changes nothing here, because no capital comes back before the sale.
Some agreements add another tier: a catch-up. After the pref is paid, the GP takes all (in a full catch-up) or most of the next dollars until it holds its promote share of all the profit so far, pref included; only then does the 80/20 split begin. On this deal a full catch-up gives the GP the next $400,000 outright, 20% of the $2M of profit paid to that point, and then 20% of the last $1.5M. Its take rises from $380,000 to $700,000, exactly 20% of the deal’s $3.5M profit, and the LP falls to $6.8M, a 12.56% IRR. Same building, same cash; one clause moves $320,000.
Where the promote lives
Now the part an architect should care about. The promote is 20% of the top of the deal, not of the whole of it. In Financial Metrics each leased home is worth $15,000 a year of NOI, net operating income, what the rent leaves after operating costs; those costs don’t shrink when homes sit empty. The deal already carries five empty homes. Price one more leased home:
- Five years of cash: $15,000 × 5 = $75,000.
- Sale value: $15,000 ÷ a 5% cap rate = $300,000.
- Together: $375,000 for that one home, and on this deal every dollar of it lands above the hurdle, in the 80/20 split.
So one more leased home pays the developer 20% of $375,000: $75,000 more, a fifth of the whole promote. It pays the investors the other 80%: $300,000 more, about 4% on top of their $7.12M. (That the GP’s $75,000 equals the home’s five years of cash, and the LP’s $300,000 its sale value, is a coincidence of this deal’s numbers, not a rule about who gets which dollars.) Run it the other way and the promote drains fast:
| Empty homes | NOI | GP promote | LP back | LP IRR |
|---|---|---|---|---|
| 4 | $615k | $455k | $7.42M | 14.75% |
| 5 (the deal) | $600k | $380k | $7.12M | 13.67% |
| 10 | $525k | $5k | $5.62M | 7.75% |
| 25 (stress case) | $300k | $0 | $0 | −100% |
At ten empty homes the investors still collect their full pref, but at a 7.75% IRR: a simple 8% pref is a lower bar than an 8% IRR hurdle, because unpaid pref never earns a return of its own. At 25% vacancy, Financial Metrics’ own stress case, NOI just covers the interest, the sale just repays the debt, and the equity recovers nothing. The LP loses $4M; the GP, with no money in, loses no cash at all.
So here is my judgment. A promote pays a developer the right way for the plan: almost nothing for a building that merely works and a lot for the one that keeps one more home leased, and Financial Metrics already traced whether homes lease at the assumed rent back to the plan. On its own, though, it is an option on roughly the top five homes’ worth of NOI that costs nothing when the bottom twenty-five go dark, and an option pays its holder to take risk. The fix is already in the capital stack Financial Metrics drew: the developer puts in $1M of the $4M. Paid like any other LP dollar, that $1M comes back as $1.78M, the promote lifts the developer to $2.16M, and at 25% vacancy it is lost with everyone else’s. Investors should pay the promote for the extra home and require the co-investment for the whole hundred. None of this models fees, taxes or compounding IRR hurdles; it only puts the building in front of the spreadsheet.